PLTR 13-day bearish forecast — Nov 8, 2026
- Bias: Bearish
- Timeframe: 13 days (made Nov 8, 2026, target date Nov 20, 2026)
- Price at analysis: $160.38
- Price target: $155.00
- Expected range: $150.00 – $167.00
- Result: Pending — graded after the close on Nov 20, 2026
Get a free AI analysis of PLTR today
Analysis
TECHNICAL INDICATORS
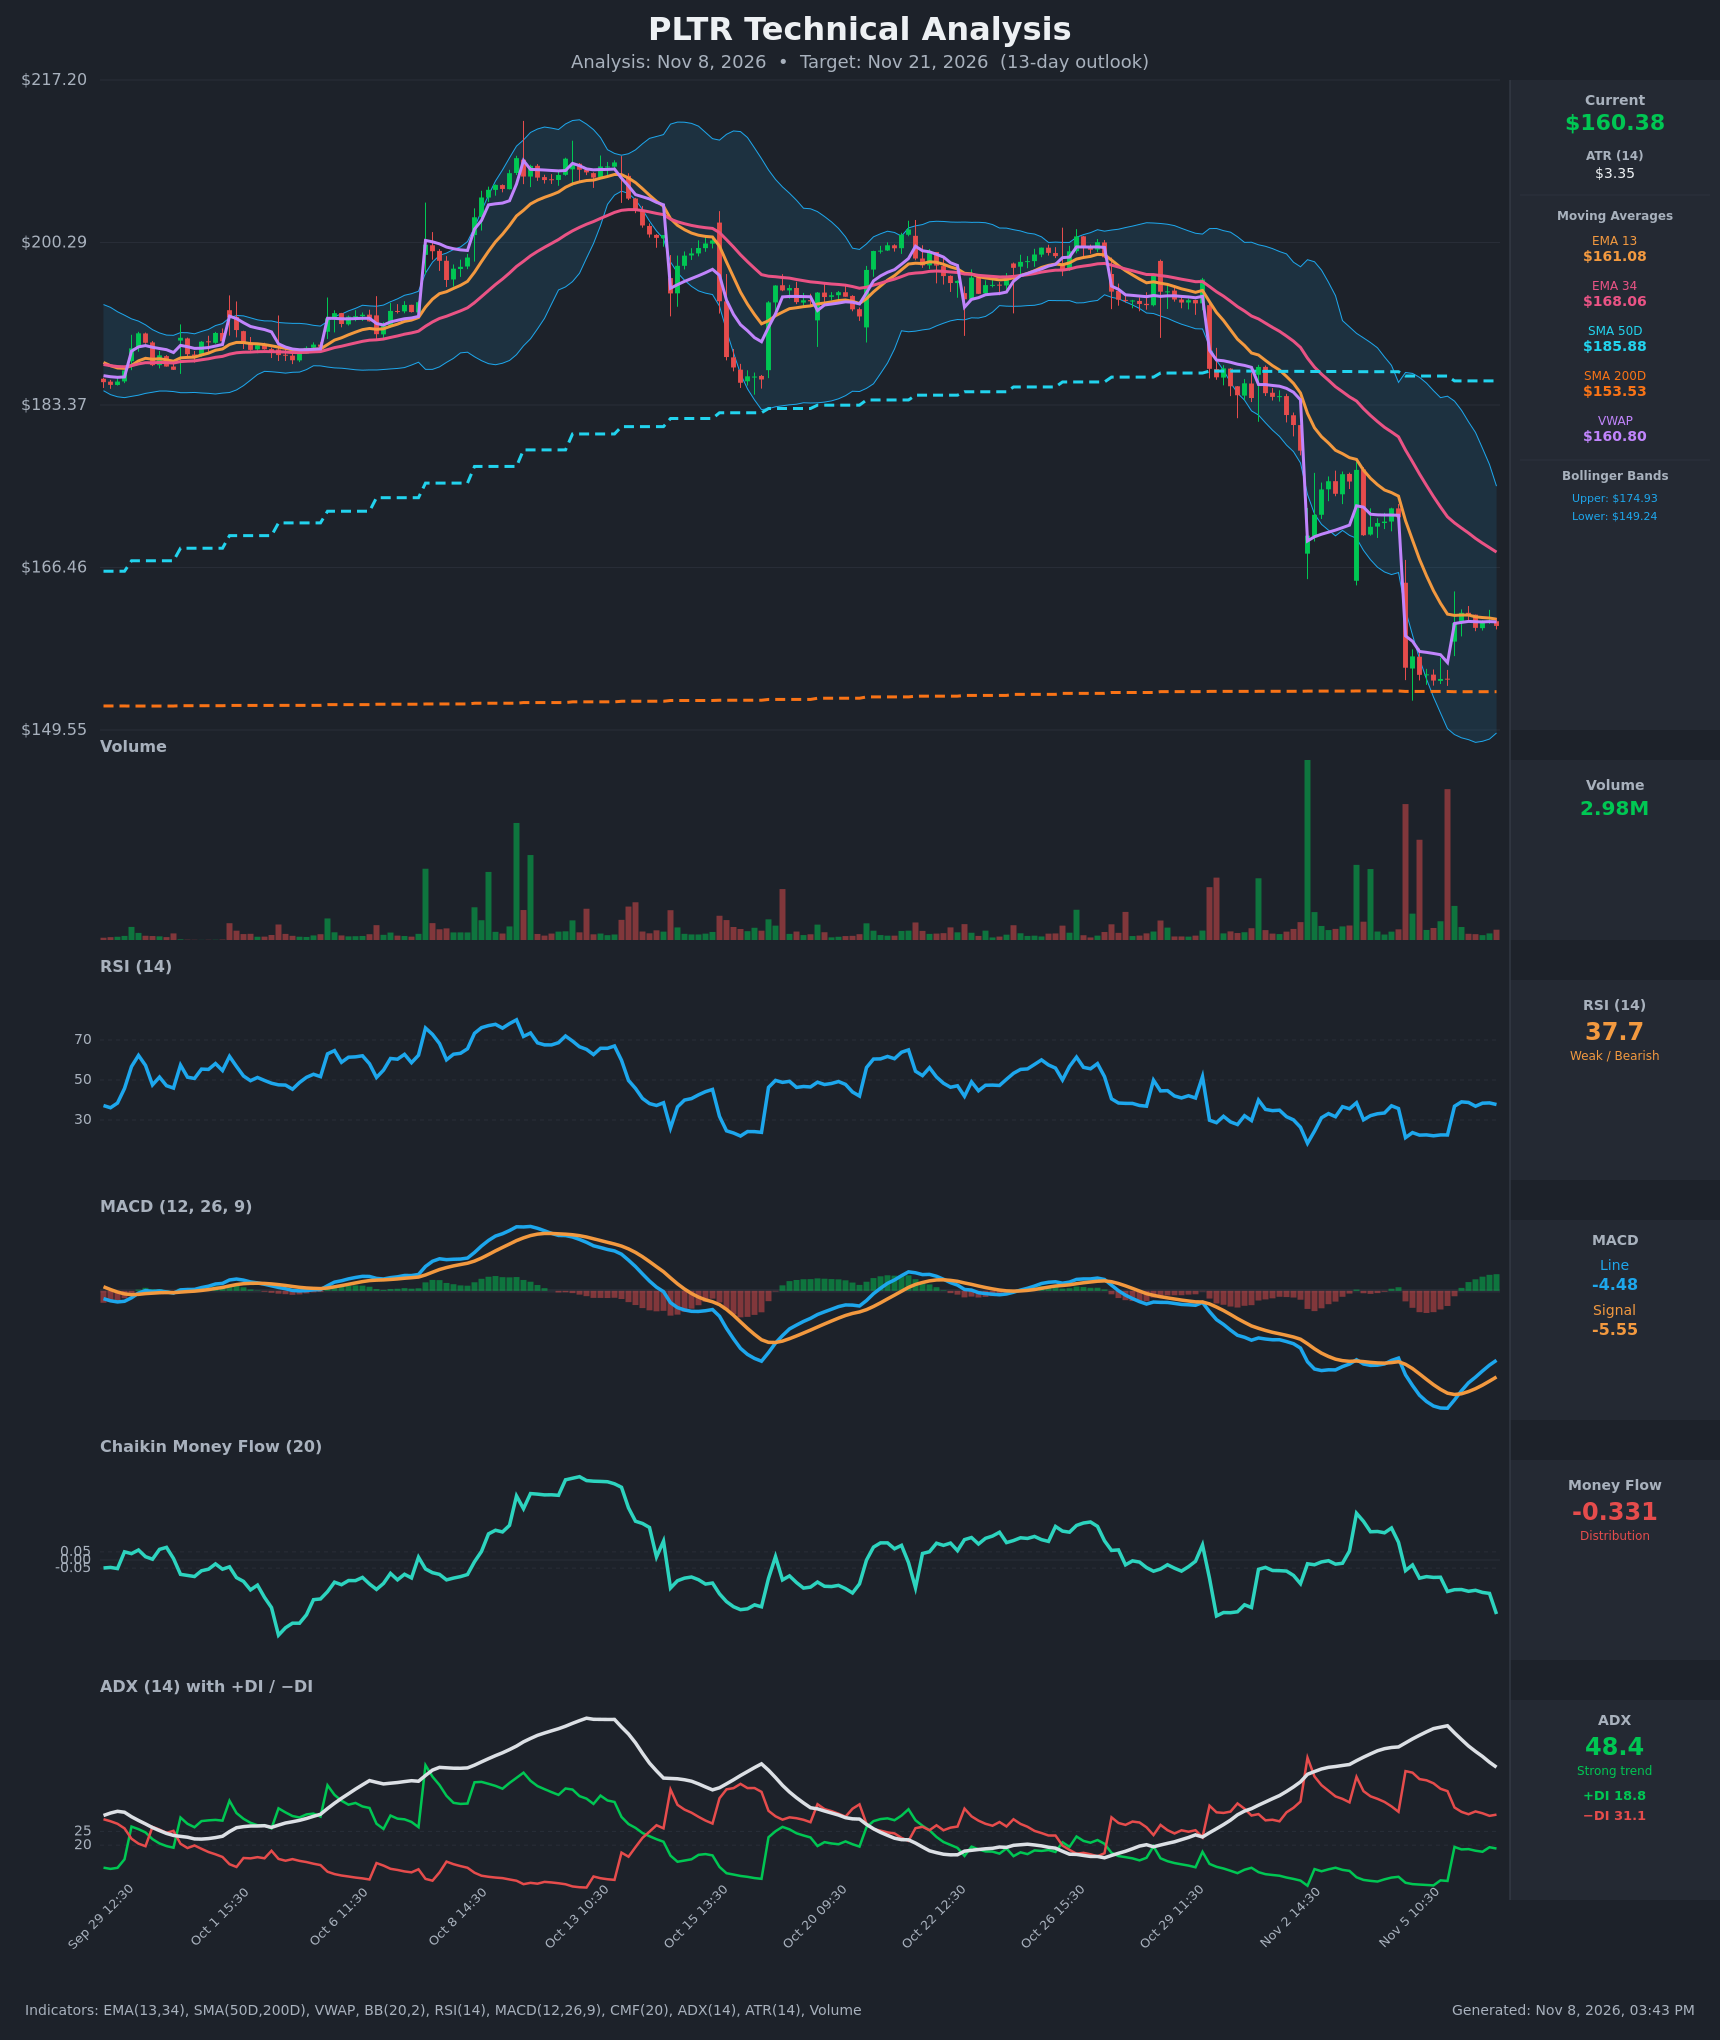
- RSI (14): 37.73, recovering from deeply oversold readings (~21-22 on Nov 5) but still below 40 and under the 50 midline. Momentum is improving off the low, yet RSI remains in bearish territory. [Bearish]
- 20 EMA: The chart shows EMA 13 at $161.08 and EMA 34 at $168.06. Price ($160.38) sits just under the flat EMA13, which is now acting as resistance. EMA13 is well below EMA34 (a bearish alignment that has held since late October), and EMA34 is sloping down above price. [Bearish]
- MACD: Line -4.48 vs. signal -5.55, so the line crossed above the signal around Nov 6 10:30. The histogram is positive and expanding. Both lines are still well below zero, so this looks like a relief bounce within a downtrend rather than a confirmed reversal. [Neutral]
- Bollinger Bands (20): Upper $174.93, lower $149.24, midline ~$162.08. Price touched or pierced the lower band during the Nov 5 flush and has returned to just below the midline. The bands are wide after the volatility expansion, and the midline is sloping down. [Neutral]
- CMF (20): -0.331, deep in distribution (well below -0.05) and making a new low even as price stabilized. Selling pressure is not fading. [Distribution]
- ADX (14): 48.4, still a strong trend but falling from a 63.6 peak. −DI (31.1) is well above +DI (18.8), so bears control. The falling ADX suggests the selloff is maturing, which favors a consolidation or bounce before the next leg. [Strong Trend – Bearish]
- Volume: 2.98M on the latest bar, much lower than the heavy-volume red bars during the Nov 4-5 breakdown. Volume dried up during the sideways stabilization. That is typical of a pause or flag, not of aggressive accumulation. [Neutral / Weak Bounce]
DIVERGENCES & TRENDS
- MACD vs. price: Price made a new low on Nov 5, but MACD has since turned up and crossed its signal line. This is a momentum improvement, not a classic divergence, and MACD is still negative.
- RSI: RSI bounced from ~21 to ~38 and has stalled in the 37-39 area, which is typical bear-market resistance. Price is flat at $160-162 while RSI is flat, so there is no clear divergence.
- CMF vs. price: CMF is making new lows (-0.331) while price holds a tight range. This is a bearish confirmation, with distribution continuing beneath the stabilization.
- Moving averages: EMA13 < EMA34, and price is below SMA50 ($185.88). Price is still above SMA200 ($153.53), so the long-term uptrend is intact but being tested. The SMA50-SMA200 gap is narrowing, and a death cross is not yet in place.
- ADX/DI: −DI dominance persists, but the ADX roll-over points to trend exhaustion, not an imminent reversal.
- VWAP: Price ($160.38) is slightly below VWAP ($160.80), a marginally bearish intraday posture.
CHART PATTERNS
- Bearish Flag / Pennant (continuation): After the sharp gap-down from ~$171 to ~$156, price has formed a tight sideways consolidation at $154-$162 on declining volume. This resembles the Bearish Flag/Pennant in the reference diagram. A break below ~$154.50 would project a measured move toward $145 or lower, but the nearby SMA200 at $153.53 is likely to slow it.
- Possible Bullish Base: The Nov 5 low, near SMA200 and the lower Bollinger Band, followed by a bounce, could develop into a double bottom. That needs a retest of ~$154-155 holding and a break above ~$165, and it is not confirmed.
- Resistance: The gap area at $165-$168 (EMA34) caps any bounce, and the pattern is more consistent with a bearish continuation than a reversal.
POTENTIAL SCENARIOS
- Scenario 1: Bearish Flag Breakdown — The tight consolidation resolves lower as distribution (CMF -0.33) and −DI dominance persist. SMA200 is tested and probably pierced intraday. Trigger: close below $154.50 on rising volume. Target: $150-$153, with an extension to ~$145 if SMA200 fails. Invalidation: daily close above $162.50, with a reclaim of EMA13/VWAP. (50% probability)
- Scenario 2: Bullish Oversold Relief Bounce — The MACD cross and RSI recovery from oversold extend into a mean-reversion rally toward the declining EMA34. Trigger: break and hold above $162.50, then $165. Target: $166-$168 (gap fill and EMA34). Invalidation: loss of $154.50. (35% probability)
- Scenario 3: Neutral Range Consolidation — Price chops between SMA200 support and EMA13/EMA34 resistance as ADX continues to decay. Trigger: failure to break $154.50 or $165. Target: $155-$165. Invalidation: a decisive close outside this range. (15% probability)
PRICE TARGETS
- Target Price: $155.00 (13-day outlook)
- Expected Range: $150.00 to $167.00 (width $17.00 ≈ 10.6% of current price, consistent with the 8-12% guidance for roughly 14 days)
- Key Levels: Support at $153.53 (SMA200), Resistance at $168.06 (EMA34). Intermediate hurdles are $161.08 (EMA13) and $165.00.
OVERALL BIAS
OVERALL BIAS: BEARISH - A strong downtrend (ADX 48, −DI 31 vs. +DI 19), deep distribution (CMF -0.33), and price below EMA34 and SMA50 with a bear-flag-like consolidation favor a drift lower toward and possibly through the SMA200 support at ~$153.5. The MACD cross and oversold RSI bounce could produce a rally, but they have been weak so far and would likely stall at $165-$168.
This is educational analysis and not financial advice.