QBTS 13-day bullish forecast — Nov 8, 2026
- Bias: Bullish
- Timeframe: 13 days (made Nov 8, 2026, target date Nov 20, 2026)
- Price at analysis: $10.66
- Price target: $10.95
- Expected range: $10.15 – $11.25
- Result: Pending — graded after the close on Nov 20, 2026
Get a free AI analysis of QBTS today
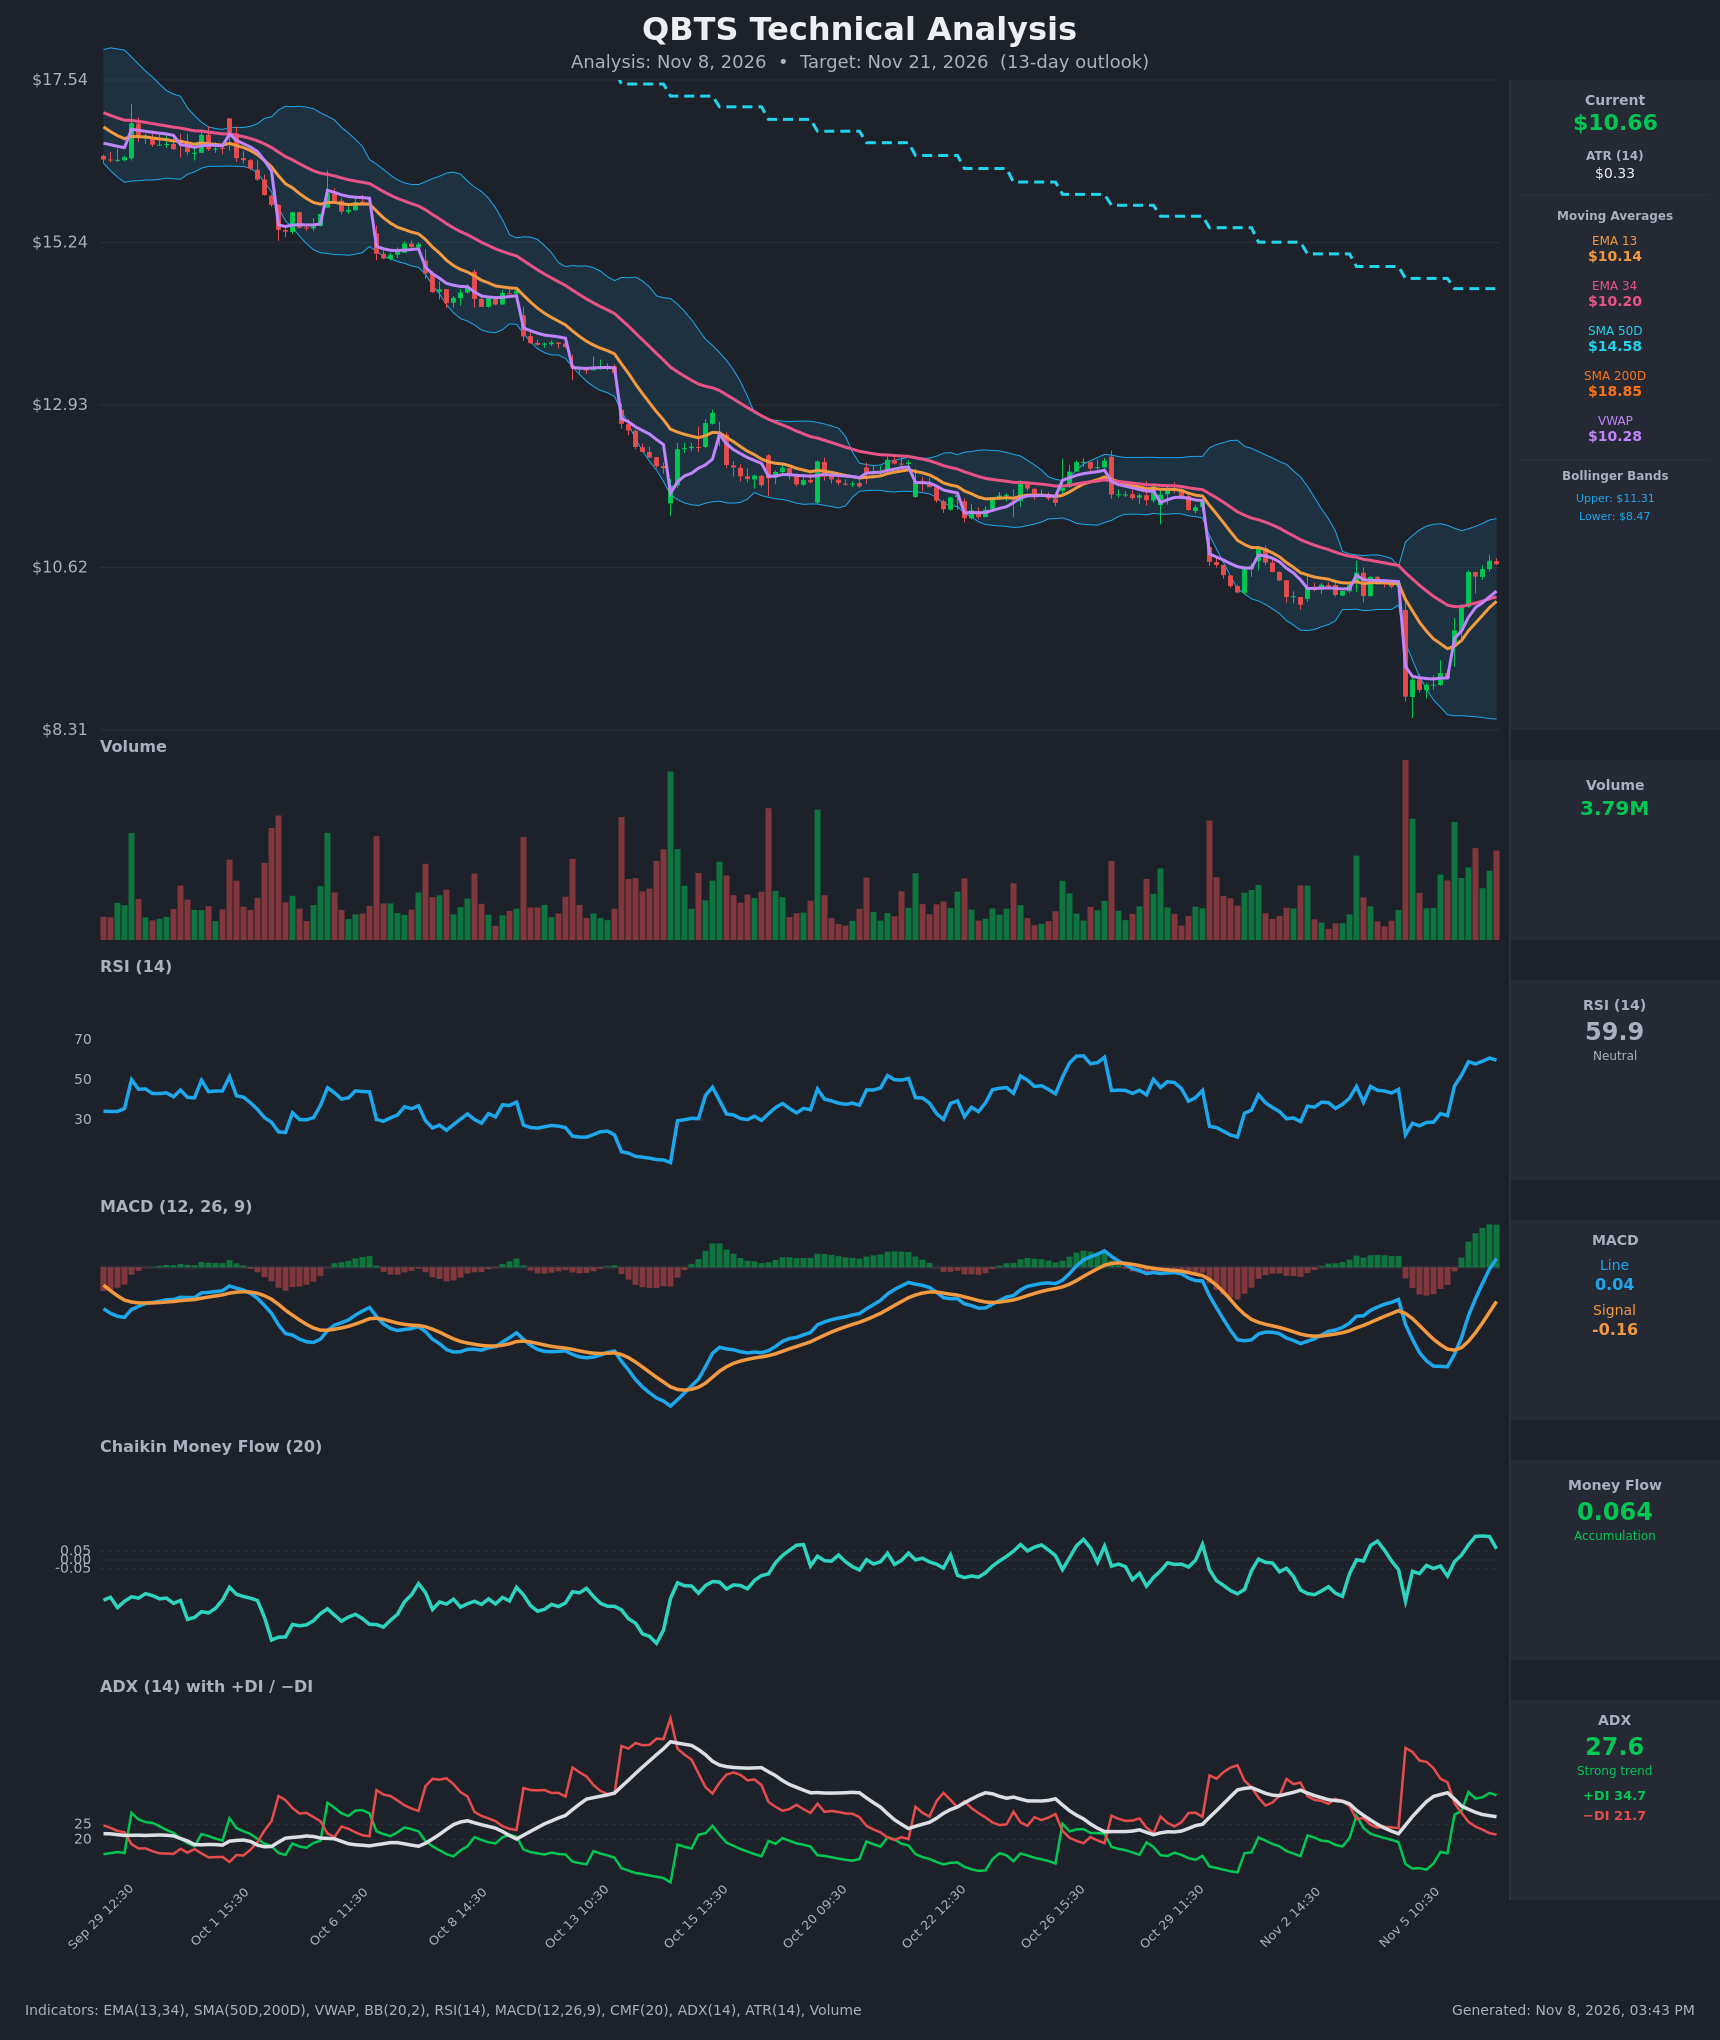
Analysis
TECHNICAL INDICATORS
- RSI (14): 59.93, up sharply from 22.6 on Nov 5 and now in bullish territory. It is not yet overbought (70), so there is room to run, but momentum has flattened slightly in the last two bars (61.0 to 59.9). [Bullish]
- 20 EMA: The chart gives EMA 13 at $10.14 and EMA 34 at $10.20, so I use those. Price at $10.67 is above both, so the 13/34 EMAs now act as support. EMA13 is still just below EMA34 (a $0.06 gap that is closing fast), so a bullish crossover looks imminent but has not yet happened. [Bullish]
- MACD: Line 0.040 vs signal -0.159. The line crossed above the signal on Nov 6 (09:30-10:30) and has just moved above zero. The histogram is positive, expanding and at its recent highs. [Bullish]
- Bollinger Bands (20): Upper $11.31, lower $8.47, midline about $9.89. Price is at roughly 77% of the band width (%B ≈ 0.77), well above the midline and walking toward the upper band. The bands are wide because of the Nov 5 capitulation spike, so the upper band at $11.31 is the nearest dynamic resistance. [Bullish]
- CMF (20): 0.064, just above the +0.05 accumulation threshold. It rose from -0.235 on Nov 5, but it has slipped from 0.137 in the last few bars, so buying pressure is positive but easing. [Accumulation]
- ADX (14): 27.6 with +DI 34.7 above −DI 21.7. This is a strong trend, and the DI crossover on Nov 6 shifted control to the bulls. ADX is slowly falling from 35.5 as the earlier bearish trend exhausts and the new bullish impulse builds. [Strong Trend + Bullish direction]
- Volume: 3.79M on the latest bar. This is moderate and well below the capitulation-day spike, but the up-bars on Nov 6 came on above-average volume. Price is also above VWAP ($10.28), a sign of buyers in control intraday. [Bullish, constructive]
DIVERGENCES & TRENDS
- No clear divergence. Price made a lower low at $8.79 on Nov 5 and RSI hit 22.6. This was a washout, not a divergence, followed by a sharp V-shaped recovery.
- Moving average crossovers: The MACD bullish crossover is confirmed. The EMA13/EMA34 bullish crossover is pending, with a gap of about $0.06. Price has reclaimed VWAP.
- Long-term trend remains bearish: Price is far below SMA50 ($14.58) and SMA200 ($18.85), and the 50-day is well below the 200-day (a death-cross configuration). Both SMAs are still falling, so any rally is counter-trend and is likely to meet heavy overhead supply.
- Momentum trend: RSI, MACD, CMF and the DI spread have all turned up from extreme lows. CMF and RSI are starting to flatten, which hints at near-term consolidation just under resistance.
- Prior structure: The $11.3-$11.6 area was the previous consolidation base, which was broken by the gap down. It is now likely resistance.
CHART PATTERNS
- Primary pattern: A V-shaped capitulation reversal (a Bullish Double Bottom in concept only). Price printed a spike low near $8.3-$8.8 and recovered over 20% in two sessions. It is not a textbook pattern because there is no second test of the low.
- Larger context: A long descending channel from $17.5 down to $8.3, with lower highs and lower lows. This is roughly a Bullish Falling Wedge structure at the low. A confirmed breakout would need a close above about $11.5, which is also the prior breakdown level.
- Risk pattern: If price stalls under $11.3-$11.5 and forms a small rising channel, that would resemble a Bearish Flag or Rising Wedge within the downtrend. A break back below $10.14 would trigger it.
- Targets: The first measured target is the upper Bollinger Band and prior support-turned-resistance at $11.3-$11.5. A break above $11.5 opens $12.0-$12.5, where the prior congestion zone sits.
POTENTIAL SCENARIOS
- Scenario 1: Bullish Rebound Continuation — The rebound extends as MACD stays above zero and EMA13 crosses above EMA34. Price grinds up toward the upper Bollinger Band and prior resistance. Trigger: hold above $10.14-$10.28 (EMA13/VWAP) and a close above $11.00. Target: $11.30-$11.60. Invalidation: a daily close below $10.14. (50% probability)
- Scenario 2: Bearish Rejection at Resistance — The bounce fades beneath the $11.3-$11.5 supply zone, as is typical in a larger downtrend below falling SMA50/200. Price rolls back through the EMAs and VWAP. Trigger: rejection at $11.3-$11.5 or a loss of $10.14 with MACD histogram fading. Target: $9.70-$10.00, with $9.00 on a deeper slide. Invalidation: a close above $11.60. (30% probability)
- Scenario 3: Neutral Consolidation — Price chops between the EMAs and upper Bollinger Band as the capitulation volatility settles. Trigger: ADX continues to fade below 25 and RSI drifts back to 50-55. Target: $10.20-$11.10. Invalidation: a close outside the $10.0-$11.4 range. (20% probability)
PRICE TARGETS
- Target Price: $10.95 (13-day, about +2.7% from $10.665)
- Expected Range: $10.15 to $11.25 (width $1.10, about 10.3% of current price, consistent with the 13-day timeframe)
- Key Levels: Support at $10.14, Resistance at $11.31
OVERALL BIAS
OVERALL BIAS: BULLISH - MACD has crossed up above zero, +DI leads −DI with ADX at 27.6, price is above the EMAs and VWAP, and CMF and RSI are positive and rising. This is a modestly bullish call, because price is still below the falling SMA50/200 and faces resistance near $11.3-$11.5.
This is educational analysis and not financial advice.