SOFI 13-day bearish forecast — Nov 8, 2026
- Bias: Bearish
- Timeframe: 13 days (made Nov 8, 2026, target date Nov 20, 2026)
- Price at analysis: $16.20
- Price target: $15.85
- Expected range: $15.05 – $16.75
- Result: Pending — graded after the close on Nov 20, 2026
Get a free AI analysis of SOFI today
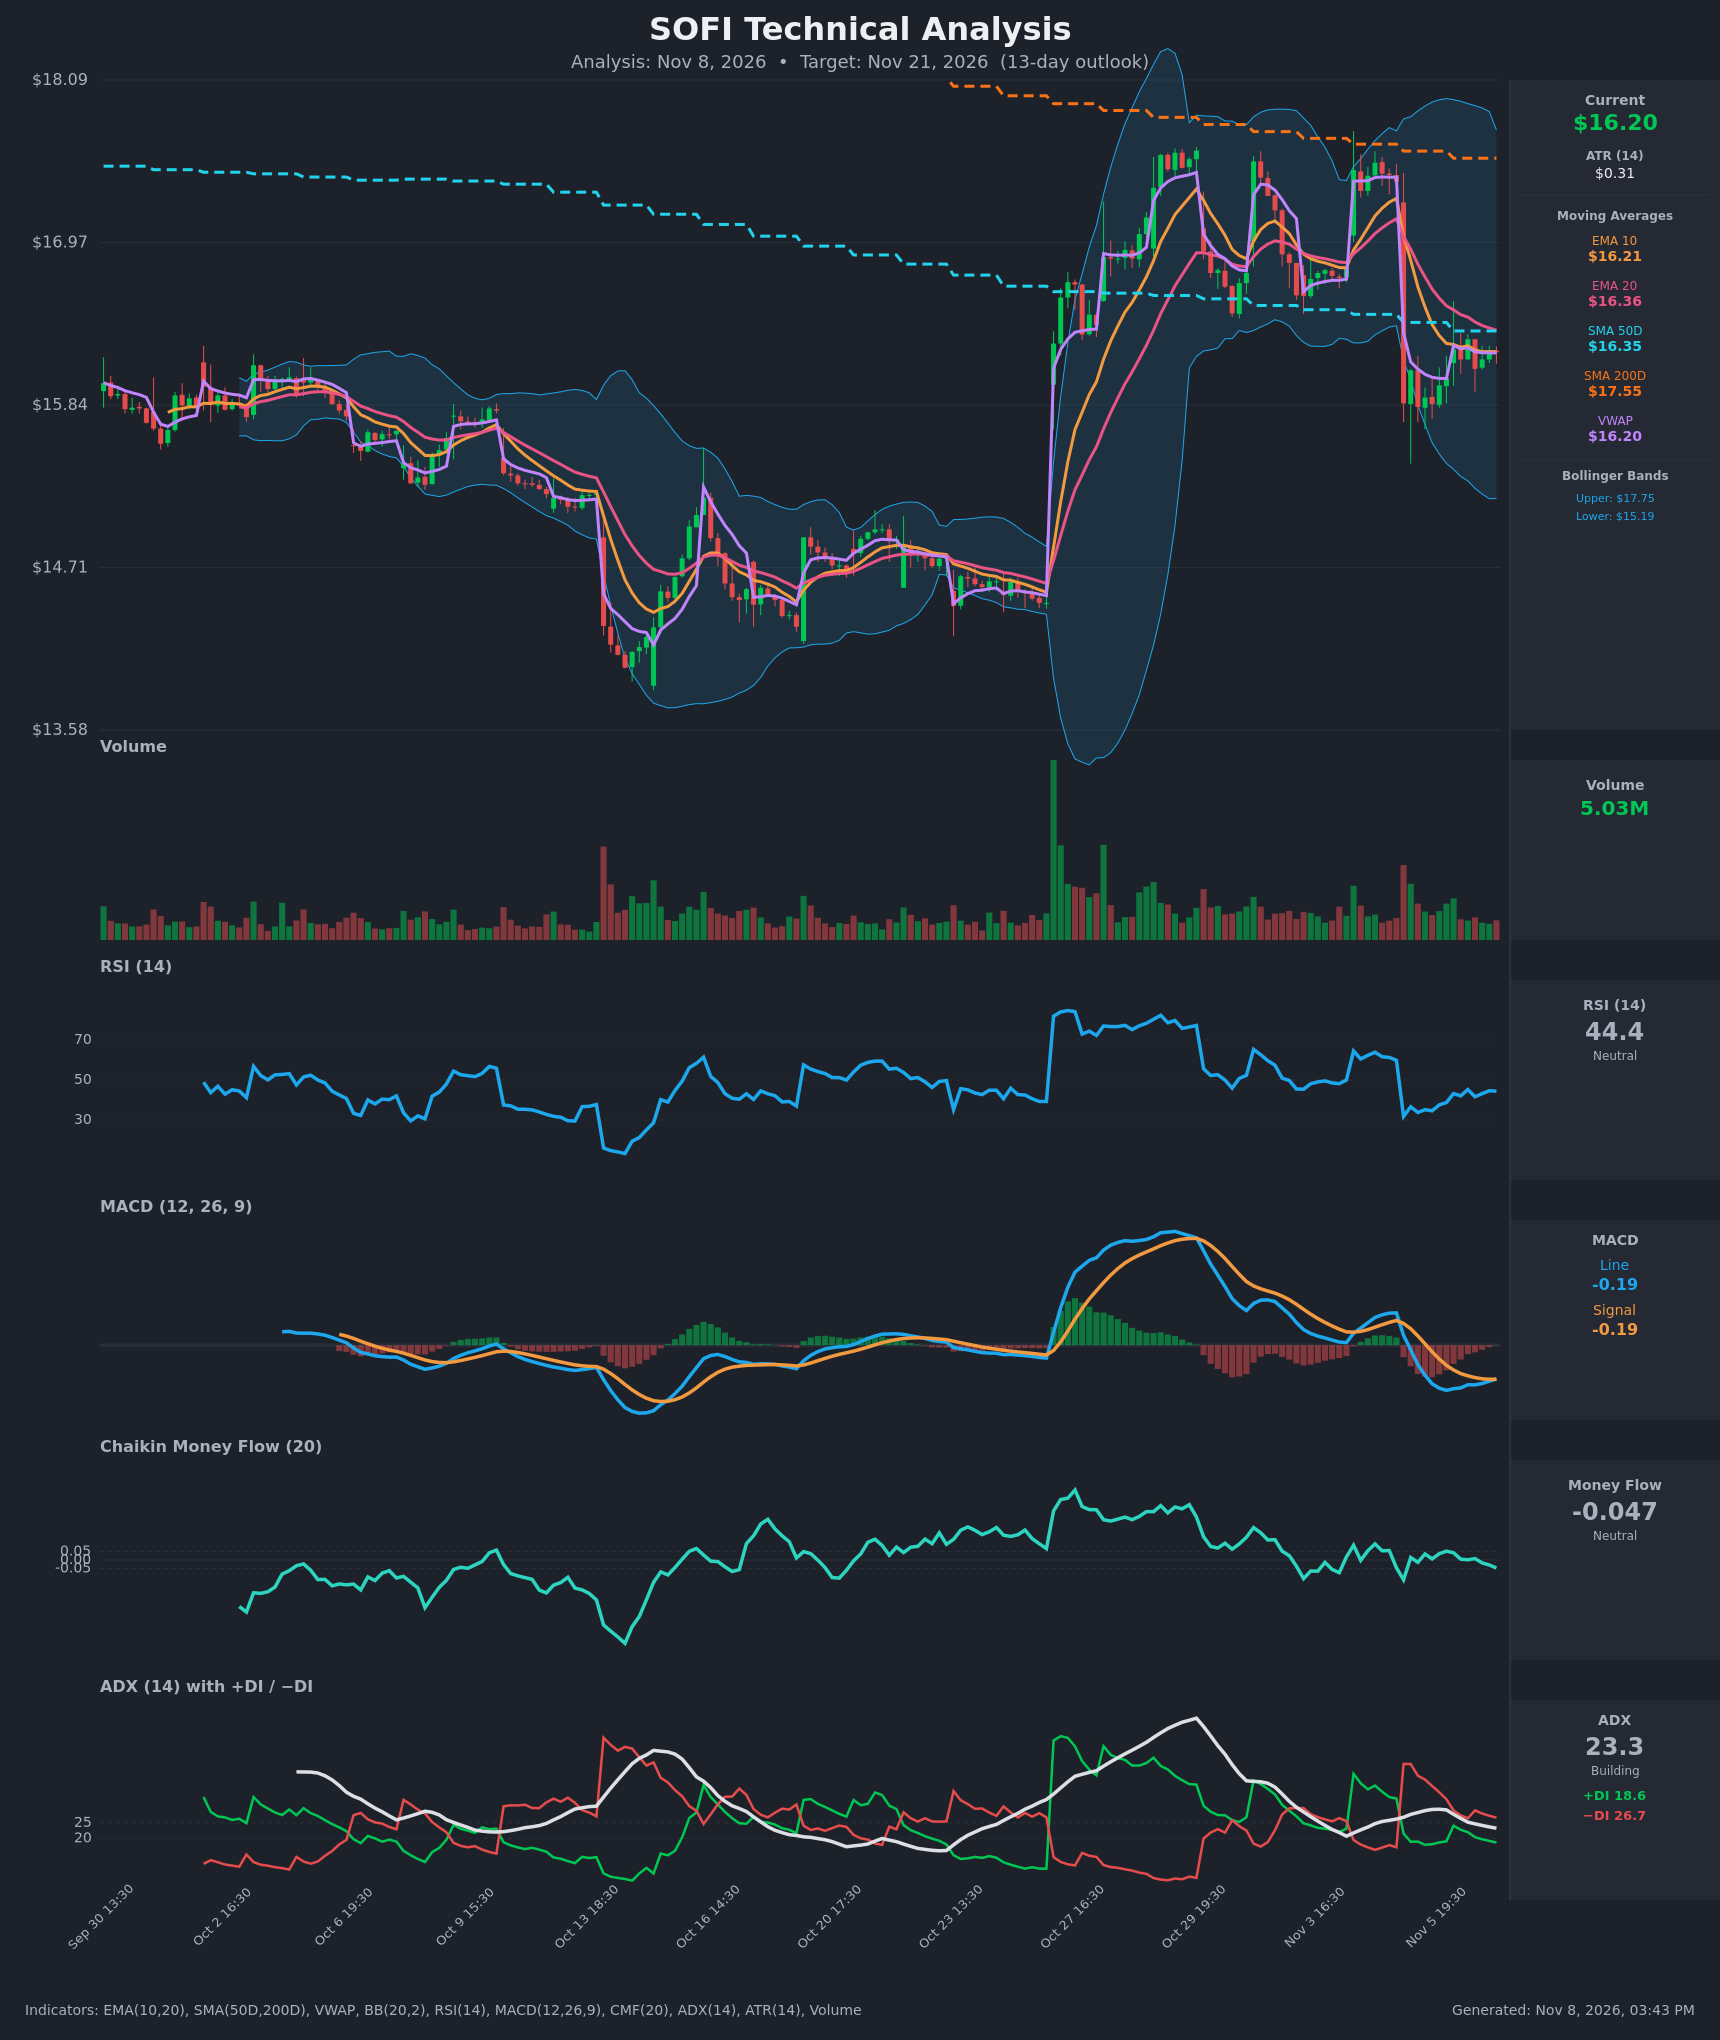
Analysis
TECHNICAL INDICATORS
- RSI (14): 44.43, below the 50 midline and recovering from the 31.8 oversold-ish low on Nov 5. It has stalled in the 42-45 zone over the last several bars, so the bounce is not gaining momentum. [Neutral]
- 20 EMA: $16.36, with price at $16.205 below it. EMA10 ($16.21) is below EMA20 and has been since the Nov 5 gap down. The 20 EMA, together with the 50 SMA at $16.35, forms overhead resistance. [Bearish]
- MACD: Line -0.186 vs signal -0.187, essentially a flat crossover attempt with a histogram near zero. The line is rising slightly from the lows, but both lines are below zero after the bearish cross on Nov 5. [Neutral]
- Bollinger Bands (20): Upper $17.75, lower $15.19, with price at $16.21 slightly below the midline (about $16.47). The bands are still wide after the late-October spike, so volatility remains elevated. Price is in the lower-middle of the range, with no squeeze or breakout signal. [Neutral]
- CMF (20): -0.047, drifting down toward the -0.05 distribution threshold. It has been sliding from the positive readings of late October. [Neutral]
- ADX (14): 23.3 and falling from the 29 peak, with −DI (26.7) above +DI (18.6). The trend is moderate and fading, but bears still control direction. [Weak/Moderate Trend, Bearish]
- Volume: 5.03M, well below the spike volumes on the late-October rally and the Nov 5 breakdown. The bounce off $15.85 is on light volume, which suggests weak buying conviction. [Low-conviction bounce]
DIVERGENCES & TRENDS
- There is no clear divergence. RSI and MACD made higher lows from Nov 5 along with price, but only modestly, which is a mild recovery rather than a reversal.
- The −DI/+DI gap has narrowed from 44 vs 19 to 26.7 vs 18.6, and ADX is falling. Selling pressure is fading but bulls have not retaken control.
- Price is below the 20 EMA, the 50 SMA ($16.35) and the 200 SMA ($17.55). The 50 SMA is under the 200 SMA, so the long-term structure is bearish.
- The Nov 5 gap and drop from $17.39 to $15.85 broke the late-October gap-up. Price has since consolidated in a tight $15.8-$16.3 range under the EMA20/SMA50 cluster.
- VWAP ($16.20) equals price, so there is no edge from that signal.
CHART PATTERNS
- Bearish Flag / Pennant: A sharp impulse drop (the $17.39 to $15.85 gap) was followed by a narrow, low-volume consolidation just below the declining EMA20/SMA50. This resembles the Bearish Flag/Pennant from the reference. A break below about $15.80 would project a measured move of roughly $1.50, toward $14.40. In practice, support near $15.19-$15.40 is likelier to cap the move.
- Broader context: The gap-up from $14.5 to $16.5 in late October has now been fully faded. This is a failed breakout, a bearish signal.
- Invalidation: A close above $16.40-$16.60 would negate the flag and open a retest of the $17 area.
POTENTIAL SCENARIOS
- Scenario 1: Bearish Flag Breakdown — The bounce fails at the EMA20/SMA50 cluster, and price loses the Nov 5 low zone with −DI still on top. Trigger: Close below $15.80. Target: $15.20 (lower Bollinger Band), then $14.80. Invalidation: Daily close above $16.60. (50% probability)
- Scenario 2: Bullish Reclaim of Moving Averages — Price reclaims the EMA20 and SMA50, MACD turns up through its signal, and the bounce extends toward the Bollinger midline and the upper range. Trigger: Close above $16.40 on rising volume. Target: $16.90-$17.30. Invalidation: Drop back below $15.85. (28% probability)
- Scenario 3: Neutral Range Chop — Price keeps oscillating between $15.80 and $16.40 as ADX decays below 20. Trigger: Failure to break either side. Target: $16.00-$16.30. Invalidation: Close outside the range. (22% probability)
PRICE TARGETS
- Target Price: $15.85 (13-day horizon)
- Expected Range: $15.05 to $16.75 (width $1.70, about 10.5% of current price, consistent with the 14-21 day guidance for a 13-day horizon)
- Key Levels: Support at $15.80, Resistance at $16.36
OVERALL BIAS
OVERALL BIAS: BEARISH - Price sits below the 20 EMA, 50 SMA and 200 SMA with −DI above +DI, and the low-volume consolidation after the gap-down looks like a bearish flag. The 13-day target of $15.85 sits modestly below the current price, which reflects moderate conviction since ADX is fading and MACD and RSI are stabilizing.
This is educational analysis and not financial advice.