RKLB 13-day bullish forecast — Nov 8, 2026
- Bias: Bullish
- Timeframe: 13 days (made Nov 8, 2026, target date Nov 20, 2026)
- Price at analysis: $53.05
- Price target: $55.20
- Expected range: $50.60 – $56.80
- Result: Pending — graded after the close on Nov 20, 2026
Get a free AI analysis of RKLB today
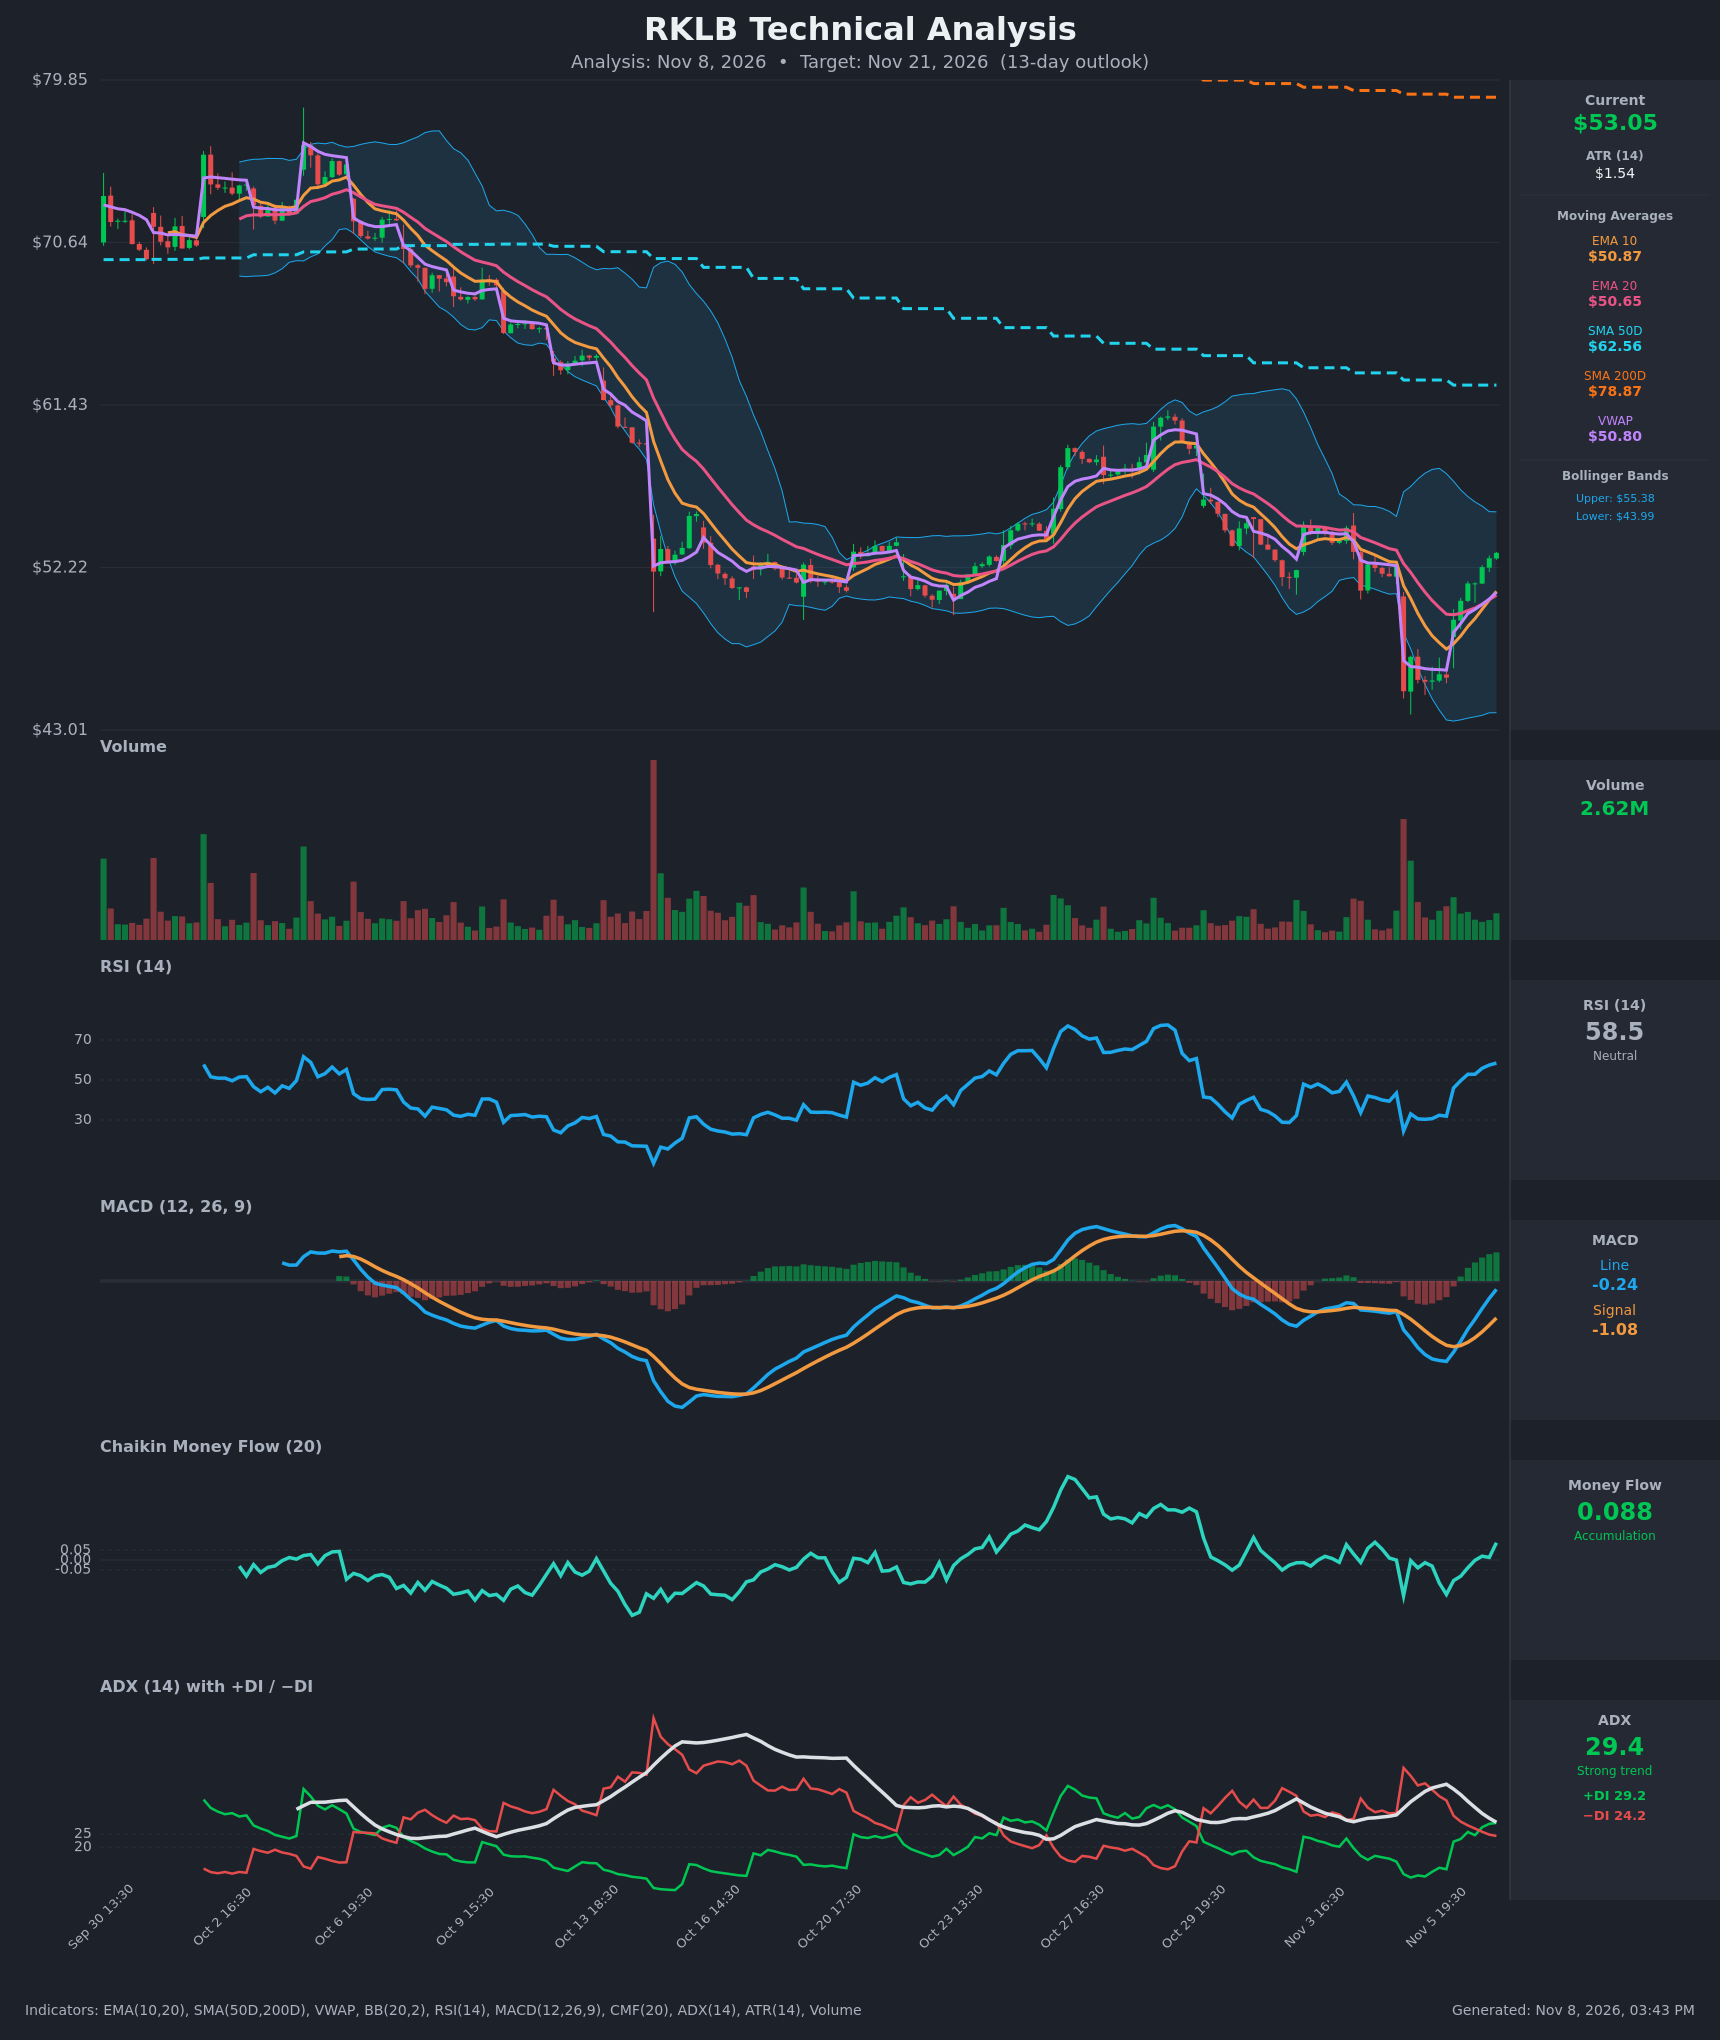
Analysis
TECHNICAL INDICATORS
- RSI (14): 58.46, up from a 24.5 oversold low on Nov 5 and now above the 50 midline. Momentum is rising, with room before the 70 overbought zone. [Bullish]
- 20 EMA: $50.65, with price ($53.05) about 4.7% above it. EMA10 ($50.87) crossed above EMA20 on Nov 6 (19:30–20:30 bars), a short-term bullish crossover. Both EMAs are now rising and should act as support on pullbacks. [Bullish]
- MACD: Line -0.244 vs Signal -1.076. The line is still below zero but has climbed from -2.34 and is closing in on the signal line. The histogram has flipped positive and is expanding, so a bullish crossover and a zero-line test are close. [Bullish]
- Bollinger Bands (20): Upper $55.38, lower $43.99, so the bands are wide after the gap-down volatility. Price sits in the upper third of the band, about $2.3 below the upper band. The move off the lower band is a mean-reversion bounce, and the upper band is near-term resistance. [Neutral]
- CMF (20): 0.088, above the +0.05 threshold. It has recovered from -0.183 on Nov 5, so buying pressure is returning. [Accumulation]
- ADX (14): 29.4 and falling from 43.8, with +DI (29.2) now above −DI (24.2). The bearish trend is fading, and bulls have taken control through a DI crossover. ADX is still above 25, so the trend is not yet range-bound. [Strong Trend, shifting from bearish to bullish]
- Volume: 2.62M on the latest bar, near the lower end of the chart's range. The Nov 5 capitulation spike was followed by green bars on rising volume during the rebound. Volume is not yet confirming a breakout. [Mildly Bullish]
DIVERGENCES & TRENDS
- Moving averages: Price is above the EMA10, EMA20 and VWAP ($50.80), but well below the SMA50 ($62.56) and SMA200 ($78.87). The SMA50 sits below the SMA200, so the long-term trend is still bearish. Overhead SMAs are resistance, not support.
- Momentum: RSI, MACD and CMF are all turning up together. There is no bearish divergence, and the Nov 5 low printed RSI at 24.5.
- Crossovers: EMA10 crossed above EMA20, and +DI crossed above −DI. A MACD bullish crossover is imminent. The sharp rebound has already filled the Nov 5 gap-down (prior close $52.38).
- Risk: The ADX peak and decline suggests the prior selling trend is exhausted. A V-shaped rebound can still stall at prior breakdown levels (~$52–55) in a bearish primary trend.
CHART PATTERNS
- Broader structure: The primary pattern is a descending channel of lower highs and lower lows from ~$75 to ~$45. This is bearish continuation territory when viewed from the larger timeframe.
- Recent action: The sharp V-shaped rebound from the $45 capitulation low resembles a short-term reversal. A Bullish Double Bottom or Triple Bottom is not clearly formed, so this is not a confirmed reversal pattern.
- Resistance zone: The $51–55 zone is the prior consolidation range from late October and early November. A sustained break above $55.4 (upper Bollinger Band) would open the $58–61 area, where the late-October peak sat.
POTENTIAL SCENARIOS
- Scenario 1: Bullish Rebound Continuation — Momentum improves as MACD crosses its signal line and +DI keeps leading, pushing price through the upper Bollinger Band. Trigger: daily close above $55.40 with volume expansion. Target: $57.00–$58.50. Invalidation: close below $50.65 (EMA20). (50% probability)
- Scenario 2: Bearish Rejection and Fade — The rebound stalls at the prior breakdown zone and the primary downtrend resumes, with price retesting the EMAs and VWAP, or the Nov 5 gap area. Trigger: rejection at $55 and a break below $50.65–$50.80. Target: $47.00–$48.50. Invalidation: close above $55.50. (30% probability)
- Scenario 3: Neutral Consolidation — Price digests the rebound between the EMAs and the upper band. Trigger: ADX continues falling with price pinned between $51 and $55. Target: $51.50–$54.50. Invalidation: close outside the $50.50–$56 band. (20% probability)
PRICE TARGETS
Range check: $56.80 − $50.60 = $6.20, which is 11.7% of $53.05. That fits the 8–12% guidance for a 13-day timeframe and is wider than a 2–3 day range.
- Target Price: $55.20 (13 days)
- Expected Range: $50.60 to $56.80
- Key Levels: Support at $50.65, Resistance at $55.38
OVERALL BIAS
OVERALL BIAS: BULLISH - RSI, MACD histogram and CMF are all turning up, and +DI has crossed above −DI. Price is above the rising EMAs and VWAP, with a modest upside target near $55.20. Gains are capped by the upper Bollinger Band and the bearish long-term SMA structure.
This is educational analysis and not financial advice.