SMH 13-day bearish forecast — Nov 8, 2026
- Bias: Bearish
- Timeframe: 13 days (made Nov 8, 2026, target date Nov 20, 2026)
- Price at analysis: $463.99
- Price target: $450.00
- Expected range: $428.00 – $474.00
- Result: Pending — graded after the close on Nov 20, 2026
Get a free AI analysis of SMH today
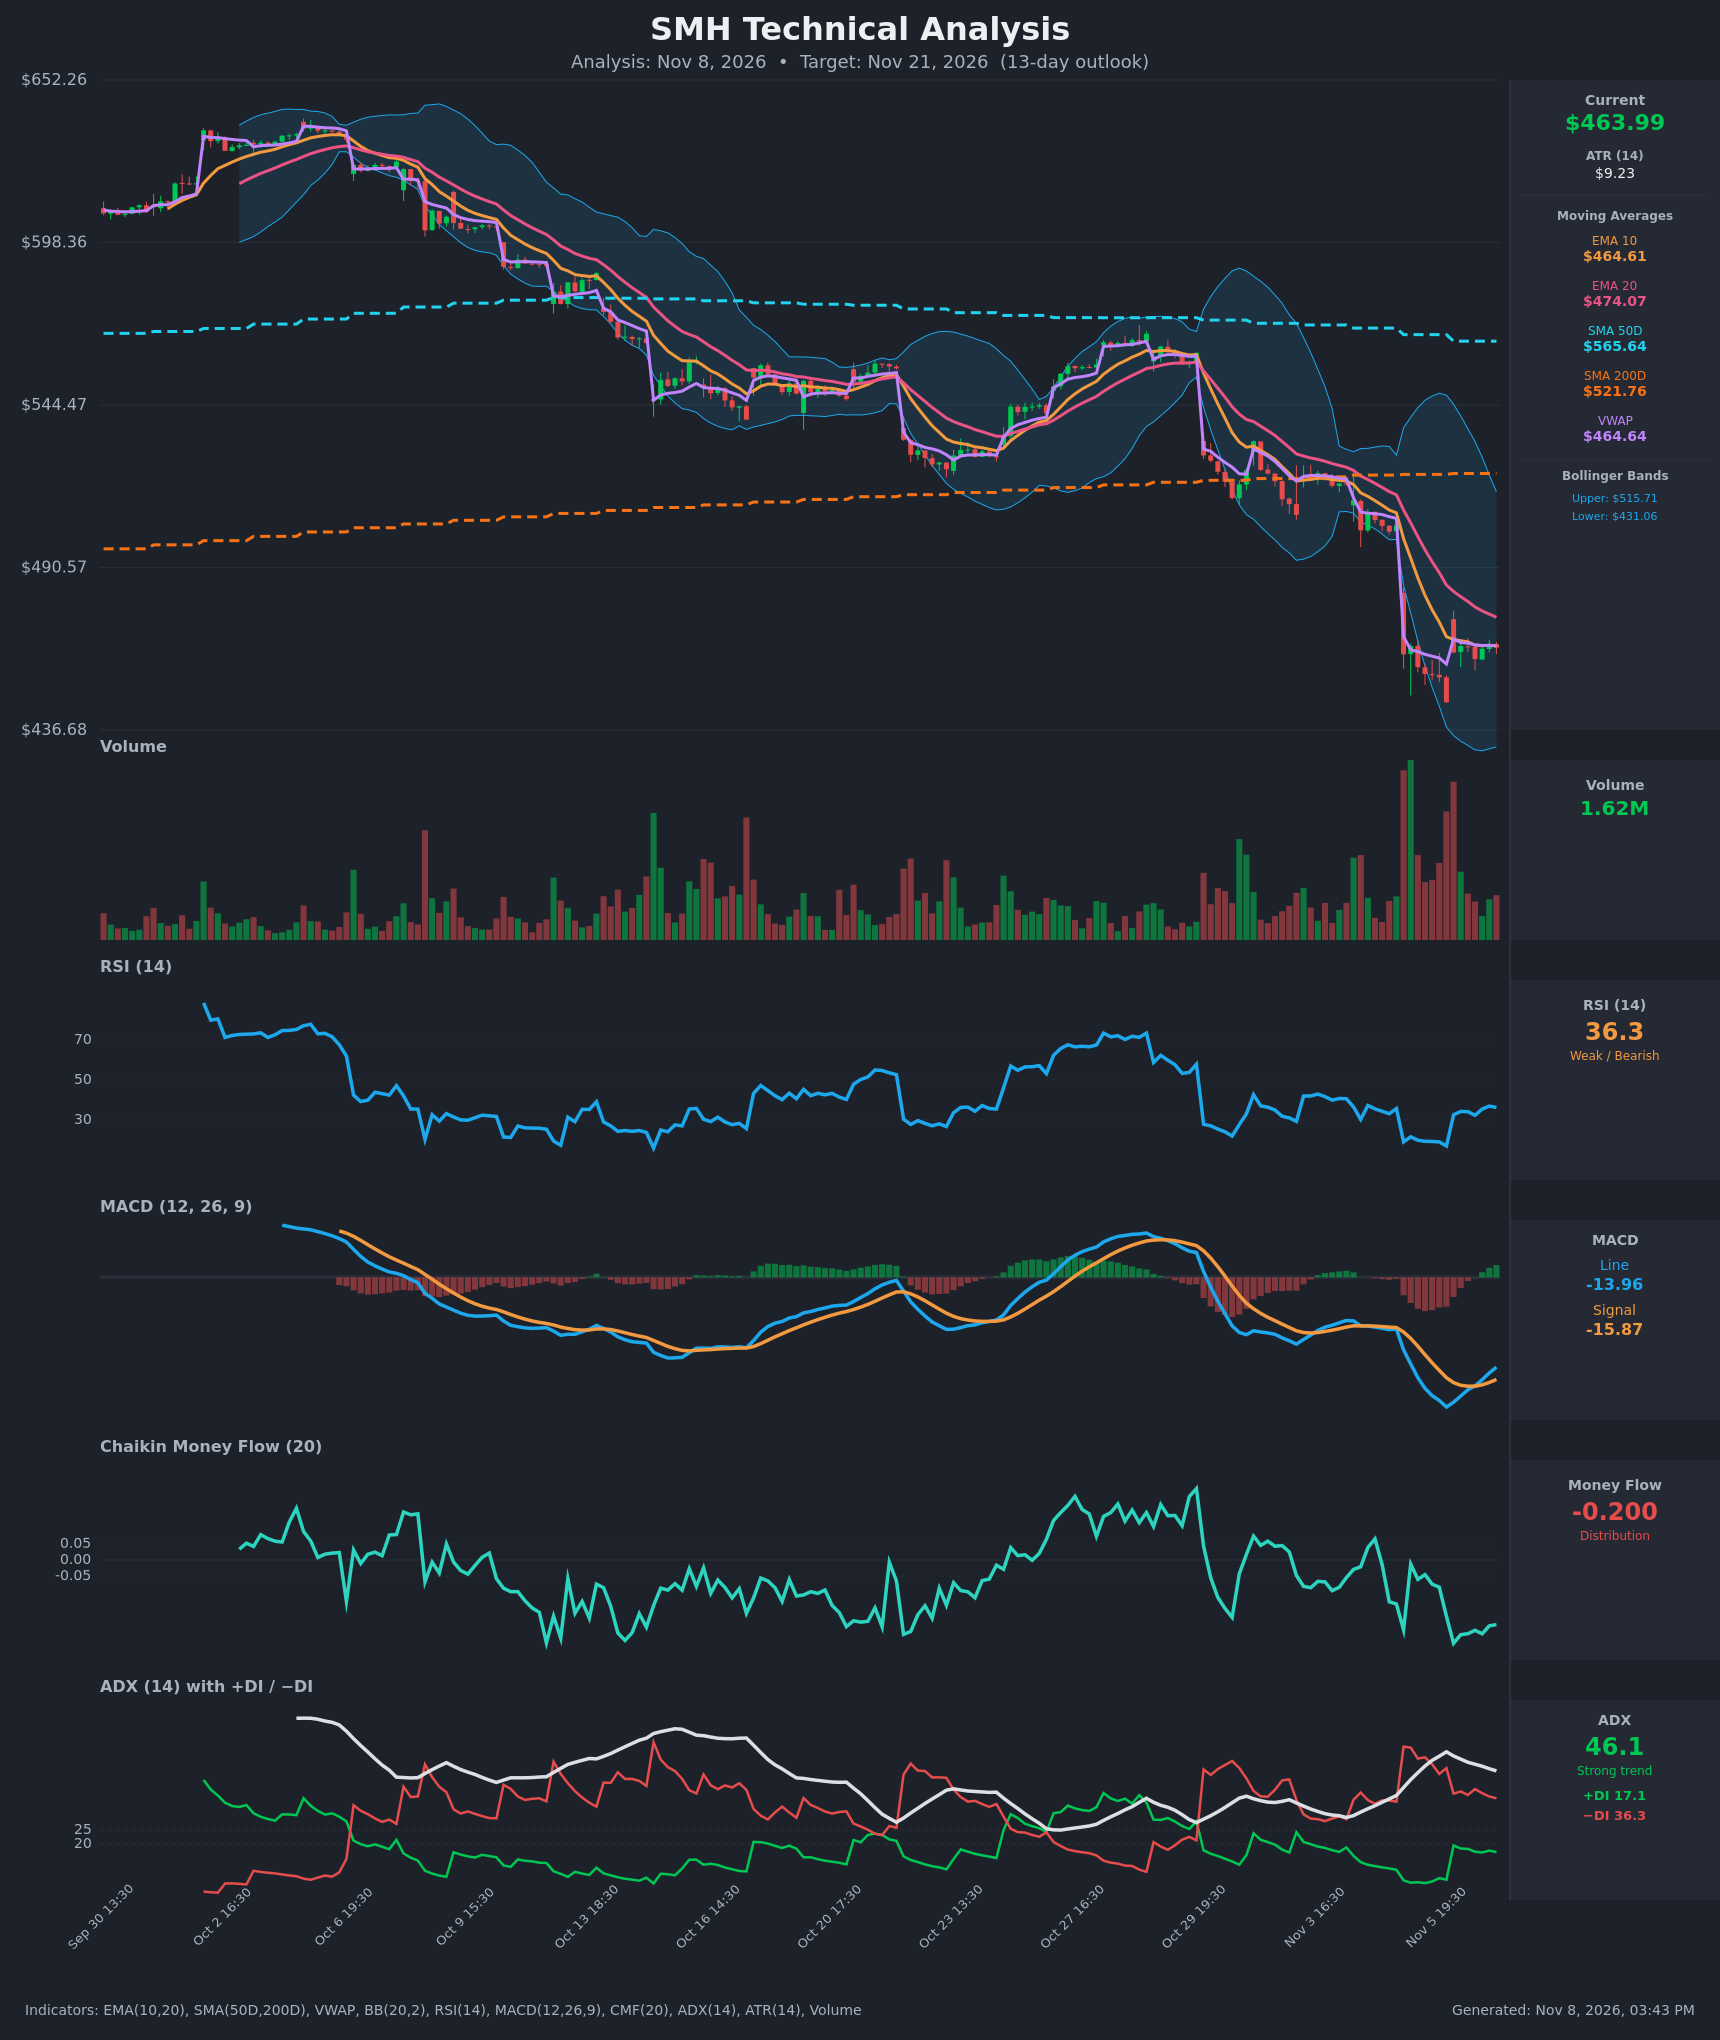
Analysis
TECHNICAL INDICATORS
- RSI (14): 36.26. It has bounced from a capitulation low of 17.0 (Nov 5 20:30) but remains below 40 and under the 50 midline, so momentum is still weak. The recovery is a relief bounce, not a trend reversal. [Bearish]
- 20 EMA: $474.07, with EMA10 at $464.61. Price ($463.99) is below the EMA20, which is now overhead resistance and about 2.2% away. EMA10 has flattened onto price, and EMA10 has been below EMA20 since the gap down. [Bearish]
- MACD: Line -13.96 versus signal -15.87, a histogram of about +1.9. The line crossed above the signal around Nov 6 17:30-18:30 and the histogram is turning positive. This is a bullish crossover, but it sits deep below zero, so it signals a relief bounce rather than a trend change. [Bullish]
- Bollinger Bands (20): Upper $515.71, lower $431.06, midline about $473.4. The bands are very wide after the gap. Price sits in the lower half, well off the lower band, and has stopped walking it. The midline, which lines up with the EMA20, is the first resistance. [Bearish]
- CMF (20): -0.200, well below the -0.05 threshold. It has been negative for the whole recent stretch with no sign of recovery, which shows persistent distribution. [Distribution]
- ADX (14): 46.1 with −DI at 36.3 over +DI at 17.1. ADX is very high but rolling over from a 52.9 peak, so the trend is still strong while the downside impulse is cooling. Sellers remain firmly in control. [Strong Trend – Bearish]
- Volume: 1.62M, fading after the huge capitulation spike on the Nov 5 gap-down. Volume is declining during the tight consolidation, which suggests selling exhaustion but no clear accumulation. Price is at VWAP ($464.64), so the two are in equilibrium. [Neutral / Selling Pressure Fading]
DIVERGENCES & TRENDS
- MACD/RSI recovery: MACD made its low at about -20.2 and RSI at 17.0 on Nov 5 20:30. Both have since improved while price holds around $460-465. This is a mild momentum improvement, not a classic bullish divergence, because price has not made a lower low on the indicators' higher lows.
- CMF: It remains at -0.20 even as RSI and MACD recover, so money flow is not confirming the bounce. This is a bearish non-confirmation.
- Moving averages: Price is far below SMA50 ($565.64) and SMA200 ($521.76). SMA50 is rolling over toward SMA200, so a death cross is possible in the coming weeks. Price is also below VWAP-anchored resistance and the EMA20.
- Trend structure: Price shows a sequence of lower highs and lower lows from the ~$640 peak. The latest drop was a ~8% gap from $504 to $462.
- ADX: It is turning down from 52.9 while −DI stays dominant, so the trend remains intact but is starting to cool.
CHART PATTERNS
- Bearish Flag / Pennant (Continuation): After the sharp gap-down, price has been consolidating in a tight $460-465 band, with the 2-day range pinned against the $445.91 low. A downside break would project a measured move of roughly the $504→$446 drop (~$58), pointing toward $390-400 over a longer horizon. A realistic 13-day target is the first leg toward the lower Bollinger Band at $431.
- Larger structure: A descending channel of lower highs since the ~$640 peak, with failed rallies at each declining EMA20. This supports the continuation bias.
- Counter-pattern: A potential short-term base (double-bottom style) at $446-455 would be confirmed only by a close above $474-480.
POTENTIAL SCENARIOS
- Scenario 1: Bearish Flag Breakdown / Trend Continuation — The tight consolidation resolves lower in line with the strong ADX, −DI dominance and persistent CMF distribution. Trigger: a close below $455, then below the $445.91 low. Target: $440-$431 (lower Bollinger Band), with price around $449 at the 13-day mark. Invalidation: a daily close above $474 (EMA20/BB midline). (45% probability)
- Scenario 2: Bullish Oversold Relief Bounce — The MACD bullish cross and RSI recovery from deep oversold lead to a mean-reversion rally toward the overhead EMA20 and gap area. Trigger: a break above $466-468 with expanding volume and CMF rising toward zero. Target: $474-$490 (EMA20, then the $490-$504 gap-fill zone). Invalidation: a close below $445. (38% probability)
- Scenario 3: Neutral Range Consolidation — Price chops between about $445 and $474 as selling exhausts but buyers fail to reclaim the EMA20. Trigger: no decisive close outside the range. Target: $455-$470. Invalidation: a close beyond either boundary. (17% probability)
PRICE TARGETS
- Target Price: $450.00 (13-day outlook, a modest decline from $463.99 as the downtrend resumes after the consolidation)
- Expected Range: $428.00 to $474.00 (width $46 ≈ 9.9% of current price, consistent with the 8-12% guidance for a 13-day horizon)
- Key Levels: Support at $445.91 (recent low, with the $431.06 lower Bollinger Band below), Resistance at $474.07 (EMA20/BB midline)
OVERALL BIAS
OVERALL BIAS: BEARISH - The strong downtrend (ADX 46, −DI 36 vs +DI 17), price below every key moving average, and heavy CMF distribution (-0.20) outweigh the MACD bullish cross and oversold RSI bounce. The tight consolidation after the gap-down resembles a bearish flag that favors a continuation lower, though the bounce risk toward $474 is real.
This is educational analysis and not financial advice.