SPY 13-day bearish forecast — Nov 8, 2026
- Bias: Bearish
- Timeframe: 13 days (made Nov 8, 2026, target date Nov 20, 2026)
- Price at analysis: $735.34
- Price target: $722.00
- Expected range: $700.00 – $758.00
- Result: Pending — graded after the close on Nov 20, 2026
Get a free AI analysis of SPY today
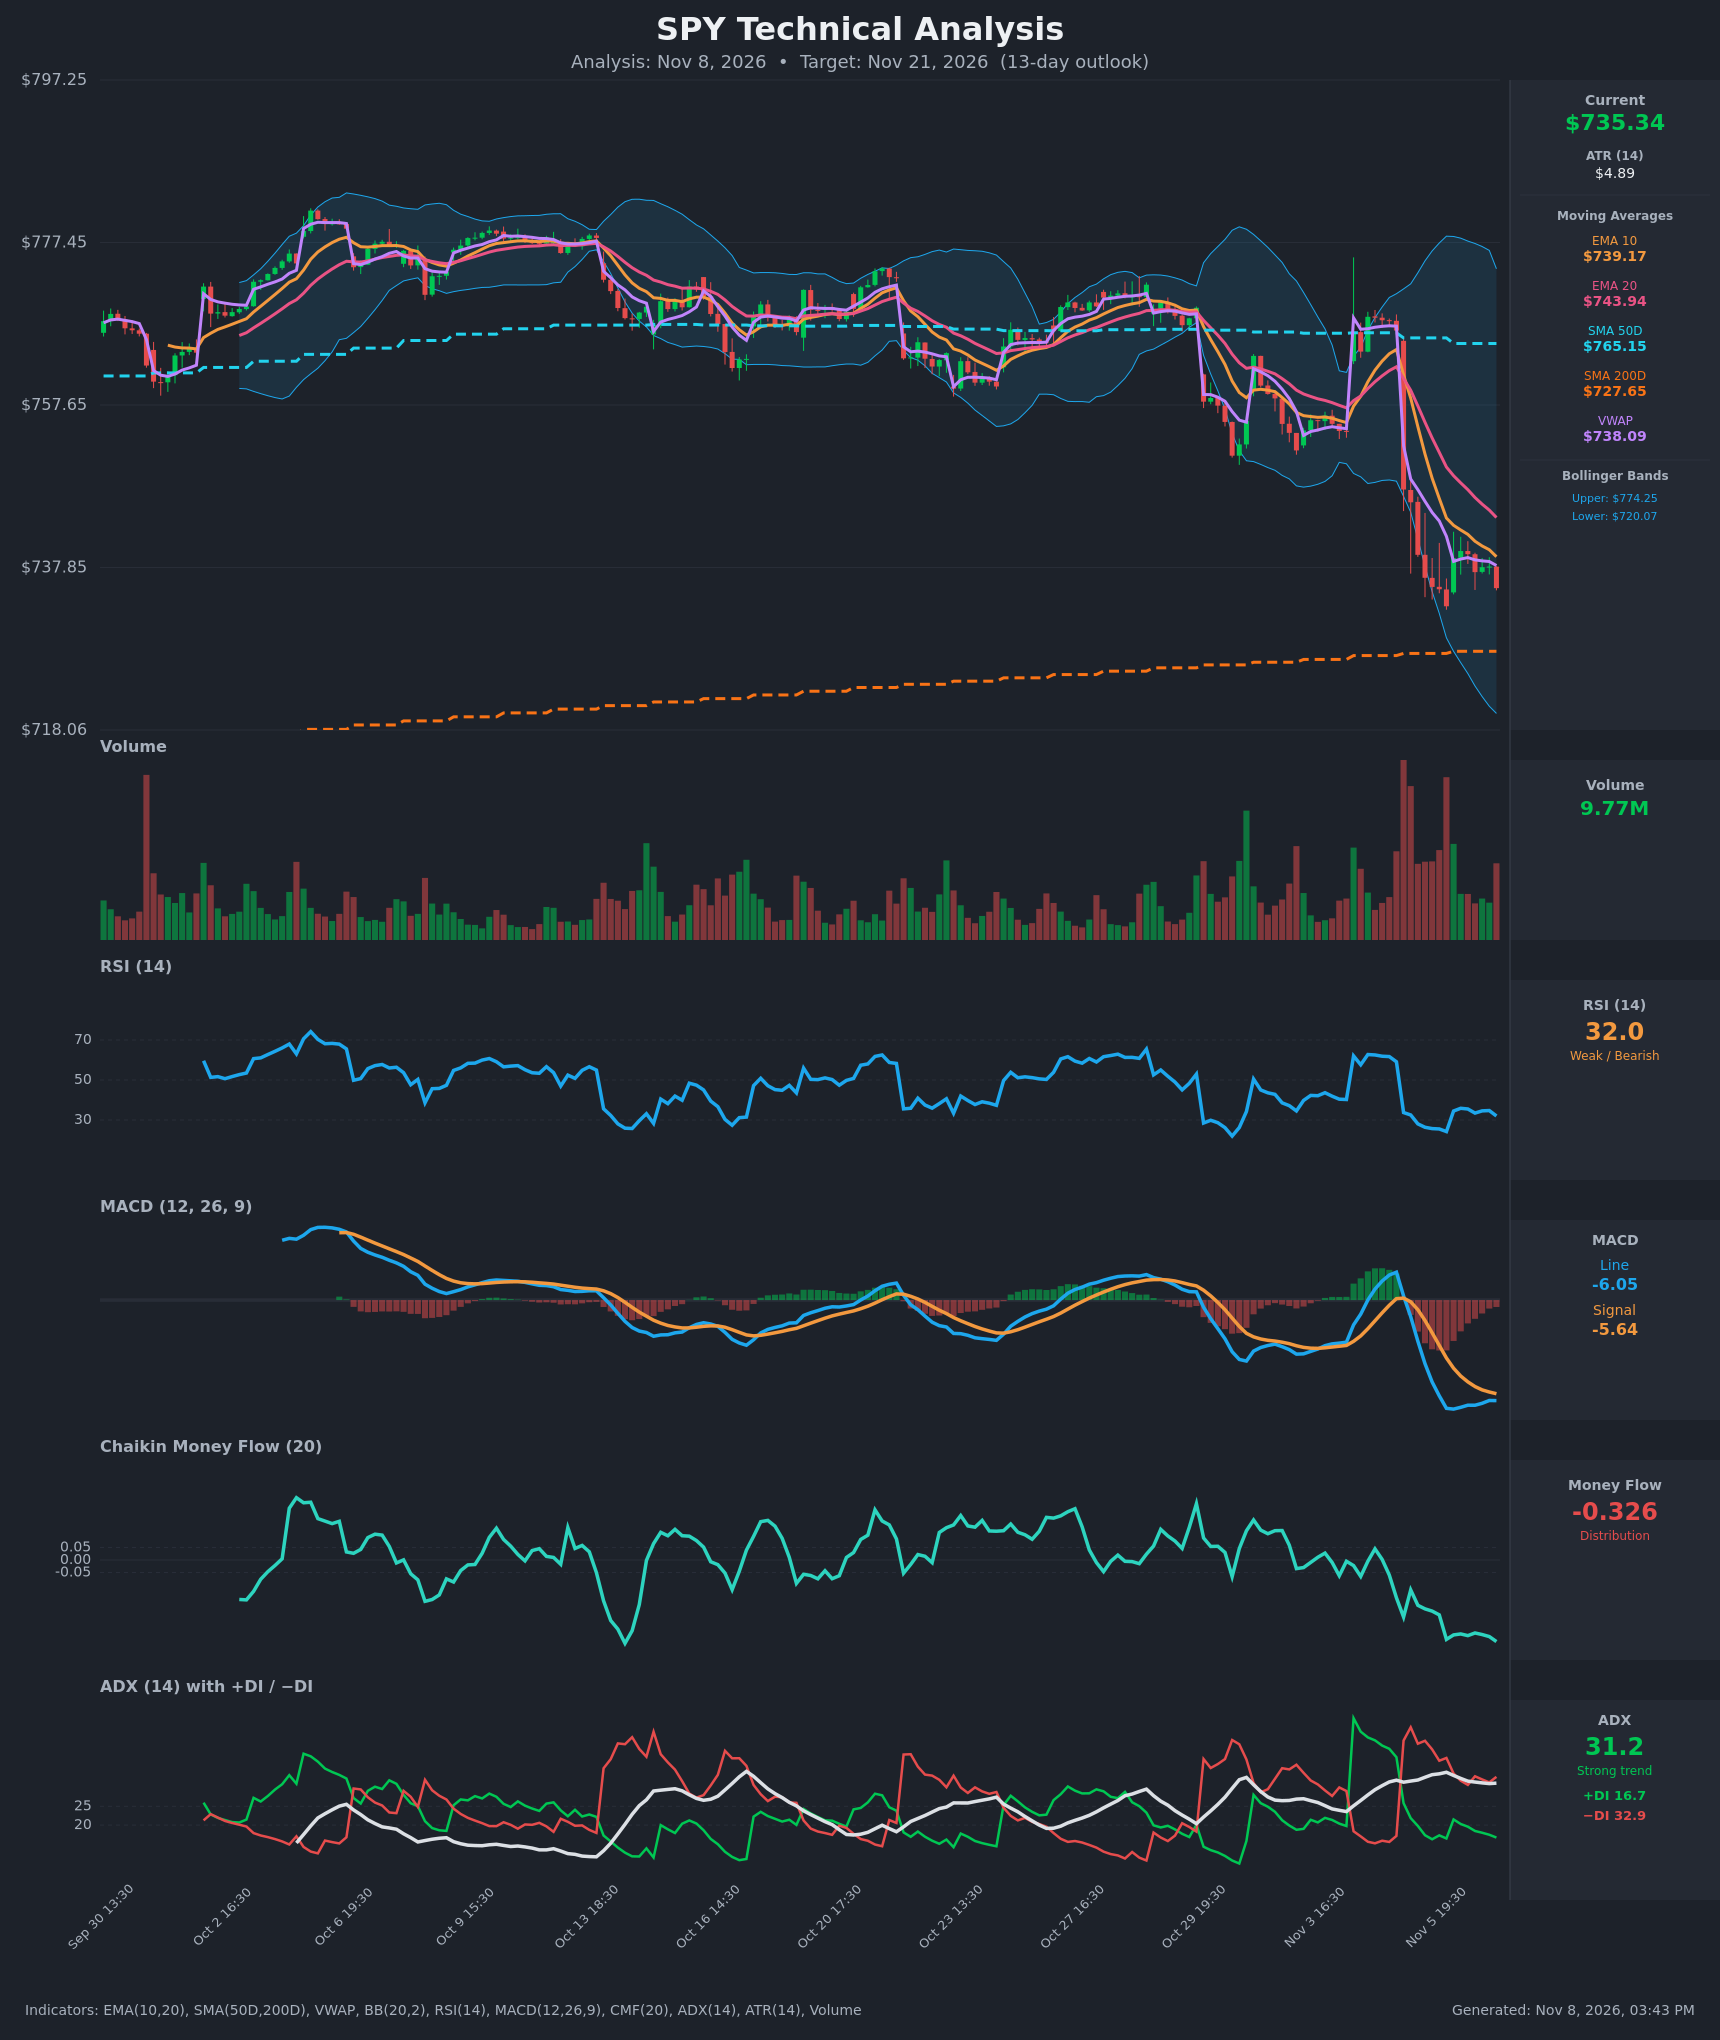
Analysis
TECHNICAL INDICATORS
- RSI (14): 32.0, just above the oversold line at 30. It dropped from 59 to a low of about 24 on Nov 5 and has only bounced to the mid-30s. Momentum is weak with no bullish divergence yet. [Bearish]
- 20 EMA: $743.94, with the 10 EMA at $739.17. Price at $735.34 is below both, and the 10 EMA is below the 20 EMA after a bearish cross on Nov 5. Both EMAs are sloping down, so the 10 and 20 act as overhead resistance. VWAP at $738.09 is also above price. [Bearish]
- MACD: Line at -6.05, signal at -5.64, histogram slightly negative. The line crossed below the signal on Nov 5 and is not recovering. Both lines are well below zero, which means bearish momentum, though the downside is flattening. [Bearish]
- Bollinger Bands (20): Upper $774.25, lower $720.07, midline about $747. Price sits in the lower third of the bands, which are widely expanded after the Nov 5 volatility spike. There is no band-walk at the lower band, so a bounce toward the midline is possible. [Bearish]
- CMF (20): -0.326, deeply negative and falling. This is heavy, sustained distribution and the weakest reading on the chart. [Distribution]
- ADX (14): 31.2 with −DI (32.9) well above +DI (16.7). The trend is strong and bears are in control. ADX has been above 30 since the selloff and is slightly fading. [Strong Trend - Bearish]
- Volume: 9.77M on the latest bar, with a cluster of very large red volume bars during the Nov 5 breakdown. Selling volume has dominated, and the bounce attempts on Nov 6 came on lighter volume. This confirms the breakdown. [Bearish]
DIVERGENCES & TRENDS
- No bullish RSI divergence yet. The RSI low (about 24) came with the price low near $733, and the second test on Nov 6 has not made a clear higher RSI low.
- MACD histogram is shrinking toward zero, so downside momentum is easing. A bullish cross has not occurred, and the gap between the lines is still negative.
- The 10 EMA crossed below the 20 EMA on Nov 5, a bearish confirmation. The 50-day SMA ($765.15) is far above price, and the 200-day SMA ($727.65) sits just below. There is no death cross: the 50 is still above the 200, but the gap is $37 and narrowing slowly.
- Price is still above the 200-day SMA, so the long-term uptrend technically holds, but it is only about 1% above that level.
- CMF has trended steadily lower since late October, and −DI crossed above +DI on Nov 5 and has stayed above it.
- Price has been making lower highs and lower lows since the late-October peak. Each rebound has been sold into the falling EMAs.
CHART PATTERNS
- Bearish Flag / Pennant (continuation): After the sharp flagpole drop from about $766 to $733, price has consolidated in a tight $733–$740 range with a slight downward slope. A break below $733 would project a measured move of roughly $30–33, or toward $700–$703. That is the extended bearish target.
- Lower-high structure (Bearish Rising Wedge-like): The failed rebounds under the 10 EMA keep the sequence of lower highs intact.
- Counter-risk: The 200-day SMA at about $727.65 and the lower Bollinger Band at about $720 are strong confluence support. Together with RSI near 30, they could produce a relief bounce toward the 20 EMA near $744–$748.
POTENTIAL SCENARIOS
- Scenario 1: Bearish Flag Breakdown — Price fails at the 10/20 EMA and VWAP, breaks the consolidation low, and then tests and slices through the 200-day SMA. Heavy distribution (CMF -0.33) and −DI dominance support continuation. Trigger: close below $733, then below $727.65. Target: $715–$720 (lower Bollinger Band), with an extension to about $703. Invalidation: close above $744 (20 EMA) on rising volume. (50% probability)
- Scenario 2: Bullish Oversold Relief Bounce — RSI near 30, the 200-day SMA and the lower Bollinger Band attract dip buyers, producing a mean-reversion rally into the declining EMAs and VWAP. Trigger: hold above $727.65 and reclaim $739–$740. Target: $748–$755 (20 EMA and Bollinger midline). Invalidation: close below $727 on volume. (35% probability)
- Scenario 3: Neutral Range Chop — Price stalls between the 200-day SMA and the EMAs as the trend exhausts. Trigger: repeated closes between $728 and $743. Target: $730–$740. Invalidation: a decisive break of either boundary. (15% probability)
PRICE TARGETS
- Target Price: $722.00 (13-day, assuming a test and partial break of the 200-day SMA)
- Expected Range: $700.00 to $758.00 (width $58, about 7.9% of the current price, scaled for the 13-day horizon)
- Key Levels: Support at $727.65 (200-day SMA, with $720.07 lower Bollinger Band below it), Resistance at $743.94 (20 EMA, with $739.17 10 EMA as first hurdle)
OVERALL BIAS
OVERALL BIAS: BEARISH - Price is below the 10 and 20 EMAs and VWAP. −DI dominates with ADX above 30, MACD is below its signal line, CMF shows heavy distribution (-0.33), and the bearish flag after a high-volume breakdown points lower. The main risk is an oversold bounce from the 200-day SMA and the lower Bollinger Band.
This is educational analysis and not financial advice.