SOXS 13-day bullish forecast — Nov 8, 2026
- Bias: Bullish
- Timeframe: 13 days (made Nov 8, 2026, target date Nov 20, 2026)
- Price at analysis: $70.98
- Price target: $73.50
- Expected range: $67.50 – $76.00
- Result: Pending — graded after the close on Nov 20, 2026
Get a free AI analysis of SOXS today
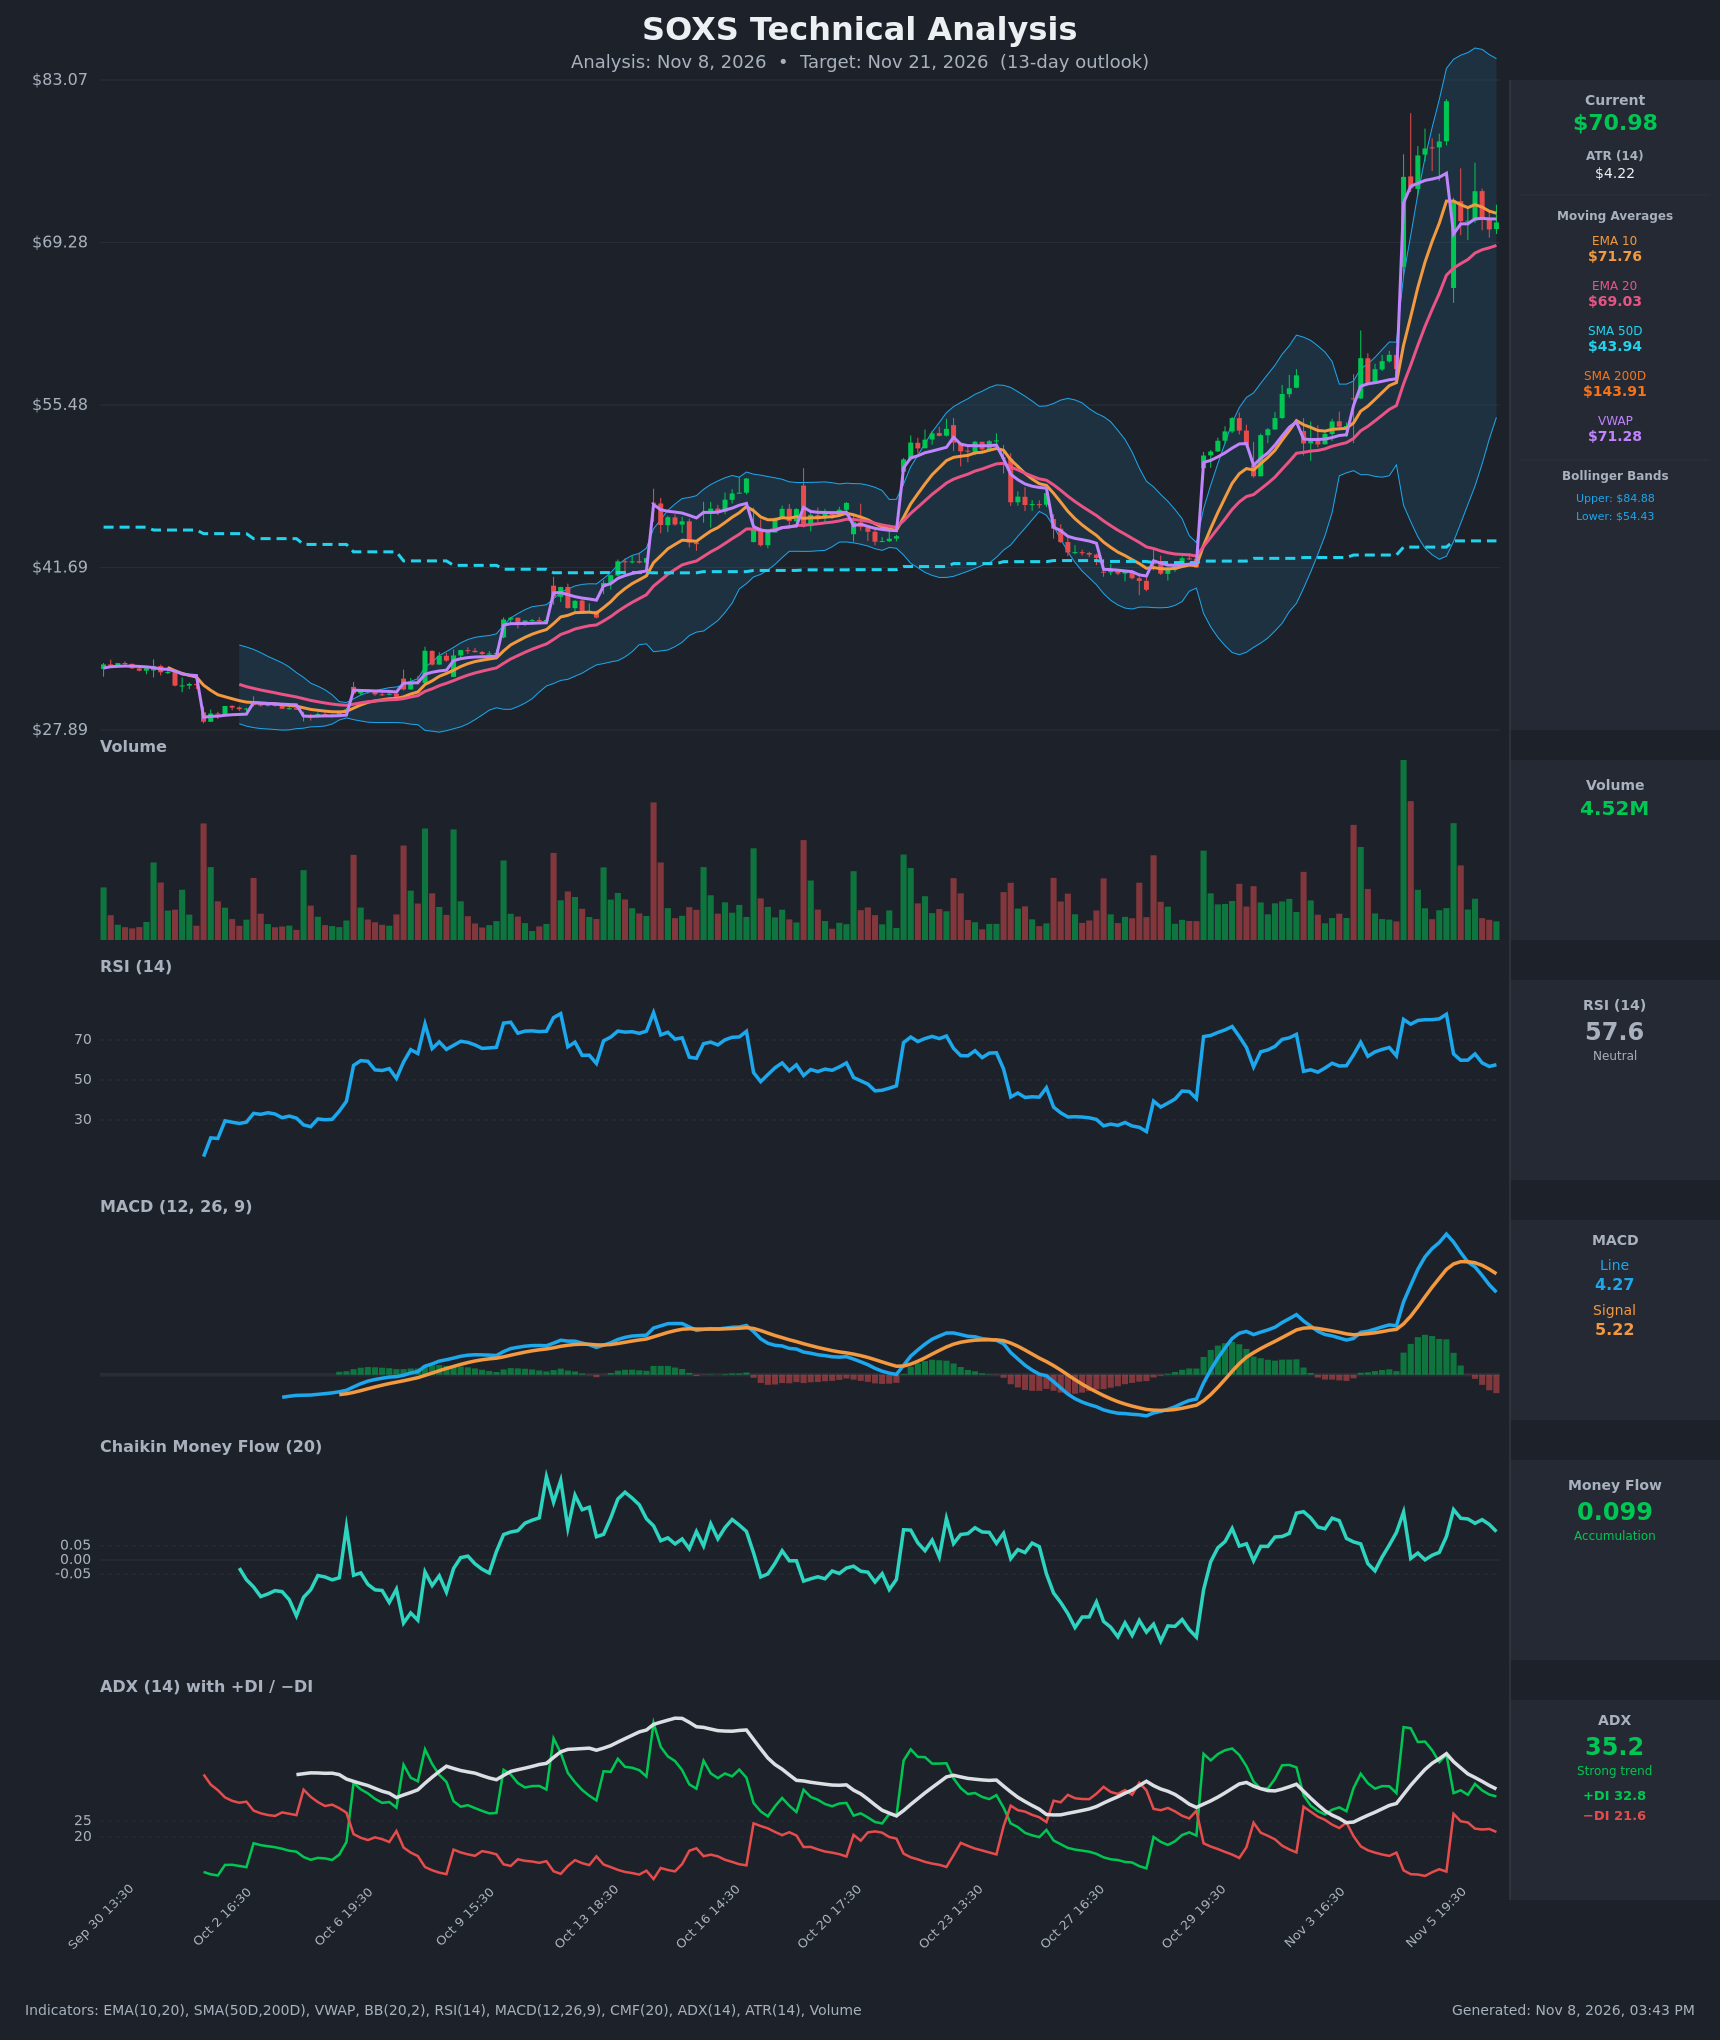
Analysis
TECHNICAL INDICATORS
- RSI (14): 57.64, down from a 80-83 overbought peak on Nov 5. It has cooled to the neutral zone, with momentum fading but not yet below 50. [Neutral]
- 20 EMA: $69.03, with price ($70.98) about 2.8% above it. The EMA is still rising and is the first dynamic support. Price sits just below the EMA10 ($71.76), a minor short-term headwind. [Bullish]
- MACD: Line 4.27 is below Signal 5.22. The bearish crossover happened around Nov 6 16:30, and the histogram is now negative and widening (about -0.95). The line has rolled over from its 7.28 peak. [Bearish]
- Bollinger Bands (20): Upper $84.88, lower $54.43, mid about $69.66. The bands are very wide after the gap-up spike. Price is just above the midline after failing near the upper band at $81.27, so this is a mean-reversion pullback. [Neutral]
- CMF (20): 0.099, above the +0.05 threshold and holding in the 0.10-0.18 range through the pullback. Buyers are still absorbing supply. [Accumulation]
- ADX (14): 35.2, down from a 46.4 peak. +DI (32.8) is above −DI (21.6), though the gap has narrowed sharply from 54.8 vs 8-9. The trend is still strong and up, but it is losing intensity. [Strong Trend, Bullish direction, weakening]
- Volume: 4.52M, below the huge spike bars on the gap day. Selling during the pullback has been on modest, fading volume, which is typical of consolidation rather than distribution. [Neutral to mildly Bullish]
Other notes:
- Price is slightly below VWAP ($71.28), a marginal sign of seller control intraday.
- The SMA200D ($143.91) sits far above price. It most likely reflects reverse-split distortion and is not a reliable signal. The SMA50D ($43.94) is far below price, confirming the medium-term uptrend.
DIVERGENCES & TRENDS
- Momentum fade: RSI fell from 80+ to 57.6 and MACD crossed below its signal while price held above $70. Momentum is cooling faster than price, which is typical of a flag or consolidation phase and not yet a reversal.
- No classic price/indicator divergence: Price made a higher high at $81.27 with RSI at 82.9 and MACD at 7.28, so there is no bearish divergence.
- ADX: Falling from 46 while +DI stays above −DI means the thrust is ending and a digestion phase is starting.
- Crossovers: The MACD bearish cross is confirmed. The EMA10 ($71.76) is converging toward the EMA20 ($69.03), but there is no EMA cross yet. There is no DI crossover, and +DI still leads.
- Trend: The structure of higher lows since the Oct 29 low near $41 remains intact.
CHART PATTERNS
- Bullish Flag / Bullish Pennant (continuation): The vertical thrust from $58.54 to $81.27 forms the pole. The tight, sideways-to-slightly-down drift in the $70-73.6 area looks like the flag body. A break above about $73.6-77 targets a measured move of pole height ($22) added to the breakout, which is an extreme case. A more conservative target is the $77-81 gap-fill area.
- Caveat: The failed push at $81.27 and the MACD cross create a risk of a Bearish Double Top / lower-high structure. A close below $69 would weaken the flag.
POTENTIAL SCENARIOS
- Scenario 1: Bullish Flag Continuation — Price holds above the EMA20 and VWAP zone, and the MACD histogram flattens as the consolidation completes. Trigger: a close above $73.60, then above $77.30. Target: $76-78, with an extension toward $81. Invalidation: a close below $69.00. (45% probability)
- Scenario 2: Bearish Pullback to Mean — The MACD cross and fading ADX lead to a deeper retracement after the spike. Trigger: a break below the EMA20 ($69.03) and the $68 area. Target: $62-65 (Fibonacci 50-62% retrace of the pole near $67-65, moving toward the BB midline and below). Invalidation: a reclaim of $73.60. (35% probability)
- Scenario 3: Neutral Range Digestion — Price chops between $67 and $75 as volatility compresses. Trigger: no break of either $69 or $73.60. Target: about $70-72. Invalidation: a decisive close outside the $67-77 range. (20% probability)
PRICE TARGETS
- Target Price: $73.50 (13-day)
- Expected Range: $67.50 to $76.00 (width $8.50, about 12% of current price, consistent with a 13-day horizon)
- Key Levels: Support at $69.03 (EMA20, then $67 and $62-65 on a deeper pullback), Resistance at $77.26 (Nov 5 consolidation high, then $81.27)
OVERALL BIAS
OVERALL BIAS: BULLISH - The strong uptrend (ADX 35, +DI above −DI), CMF accumulation, price above the rising EMA20, and a flag-like consolidation after a vertical thrust favor continuation. The bearish MACD cross and fading RSI keep conviction modest, and a close below $69 would invalidate the call.
This is educational analysis and not financial advice.