SOXL 13-day bearish forecast — Nov 8, 2026
- Bias: Bearish
- Timeframe: 13 days (made Nov 8, 2026, target date Nov 20, 2026)
- Price at analysis: $45.94
- Price target: $43.20
- Expected range: $41.50 – $47.50
- Result: Pending — graded after the close on Nov 20, 2026
Get a free AI analysis of SOXL today
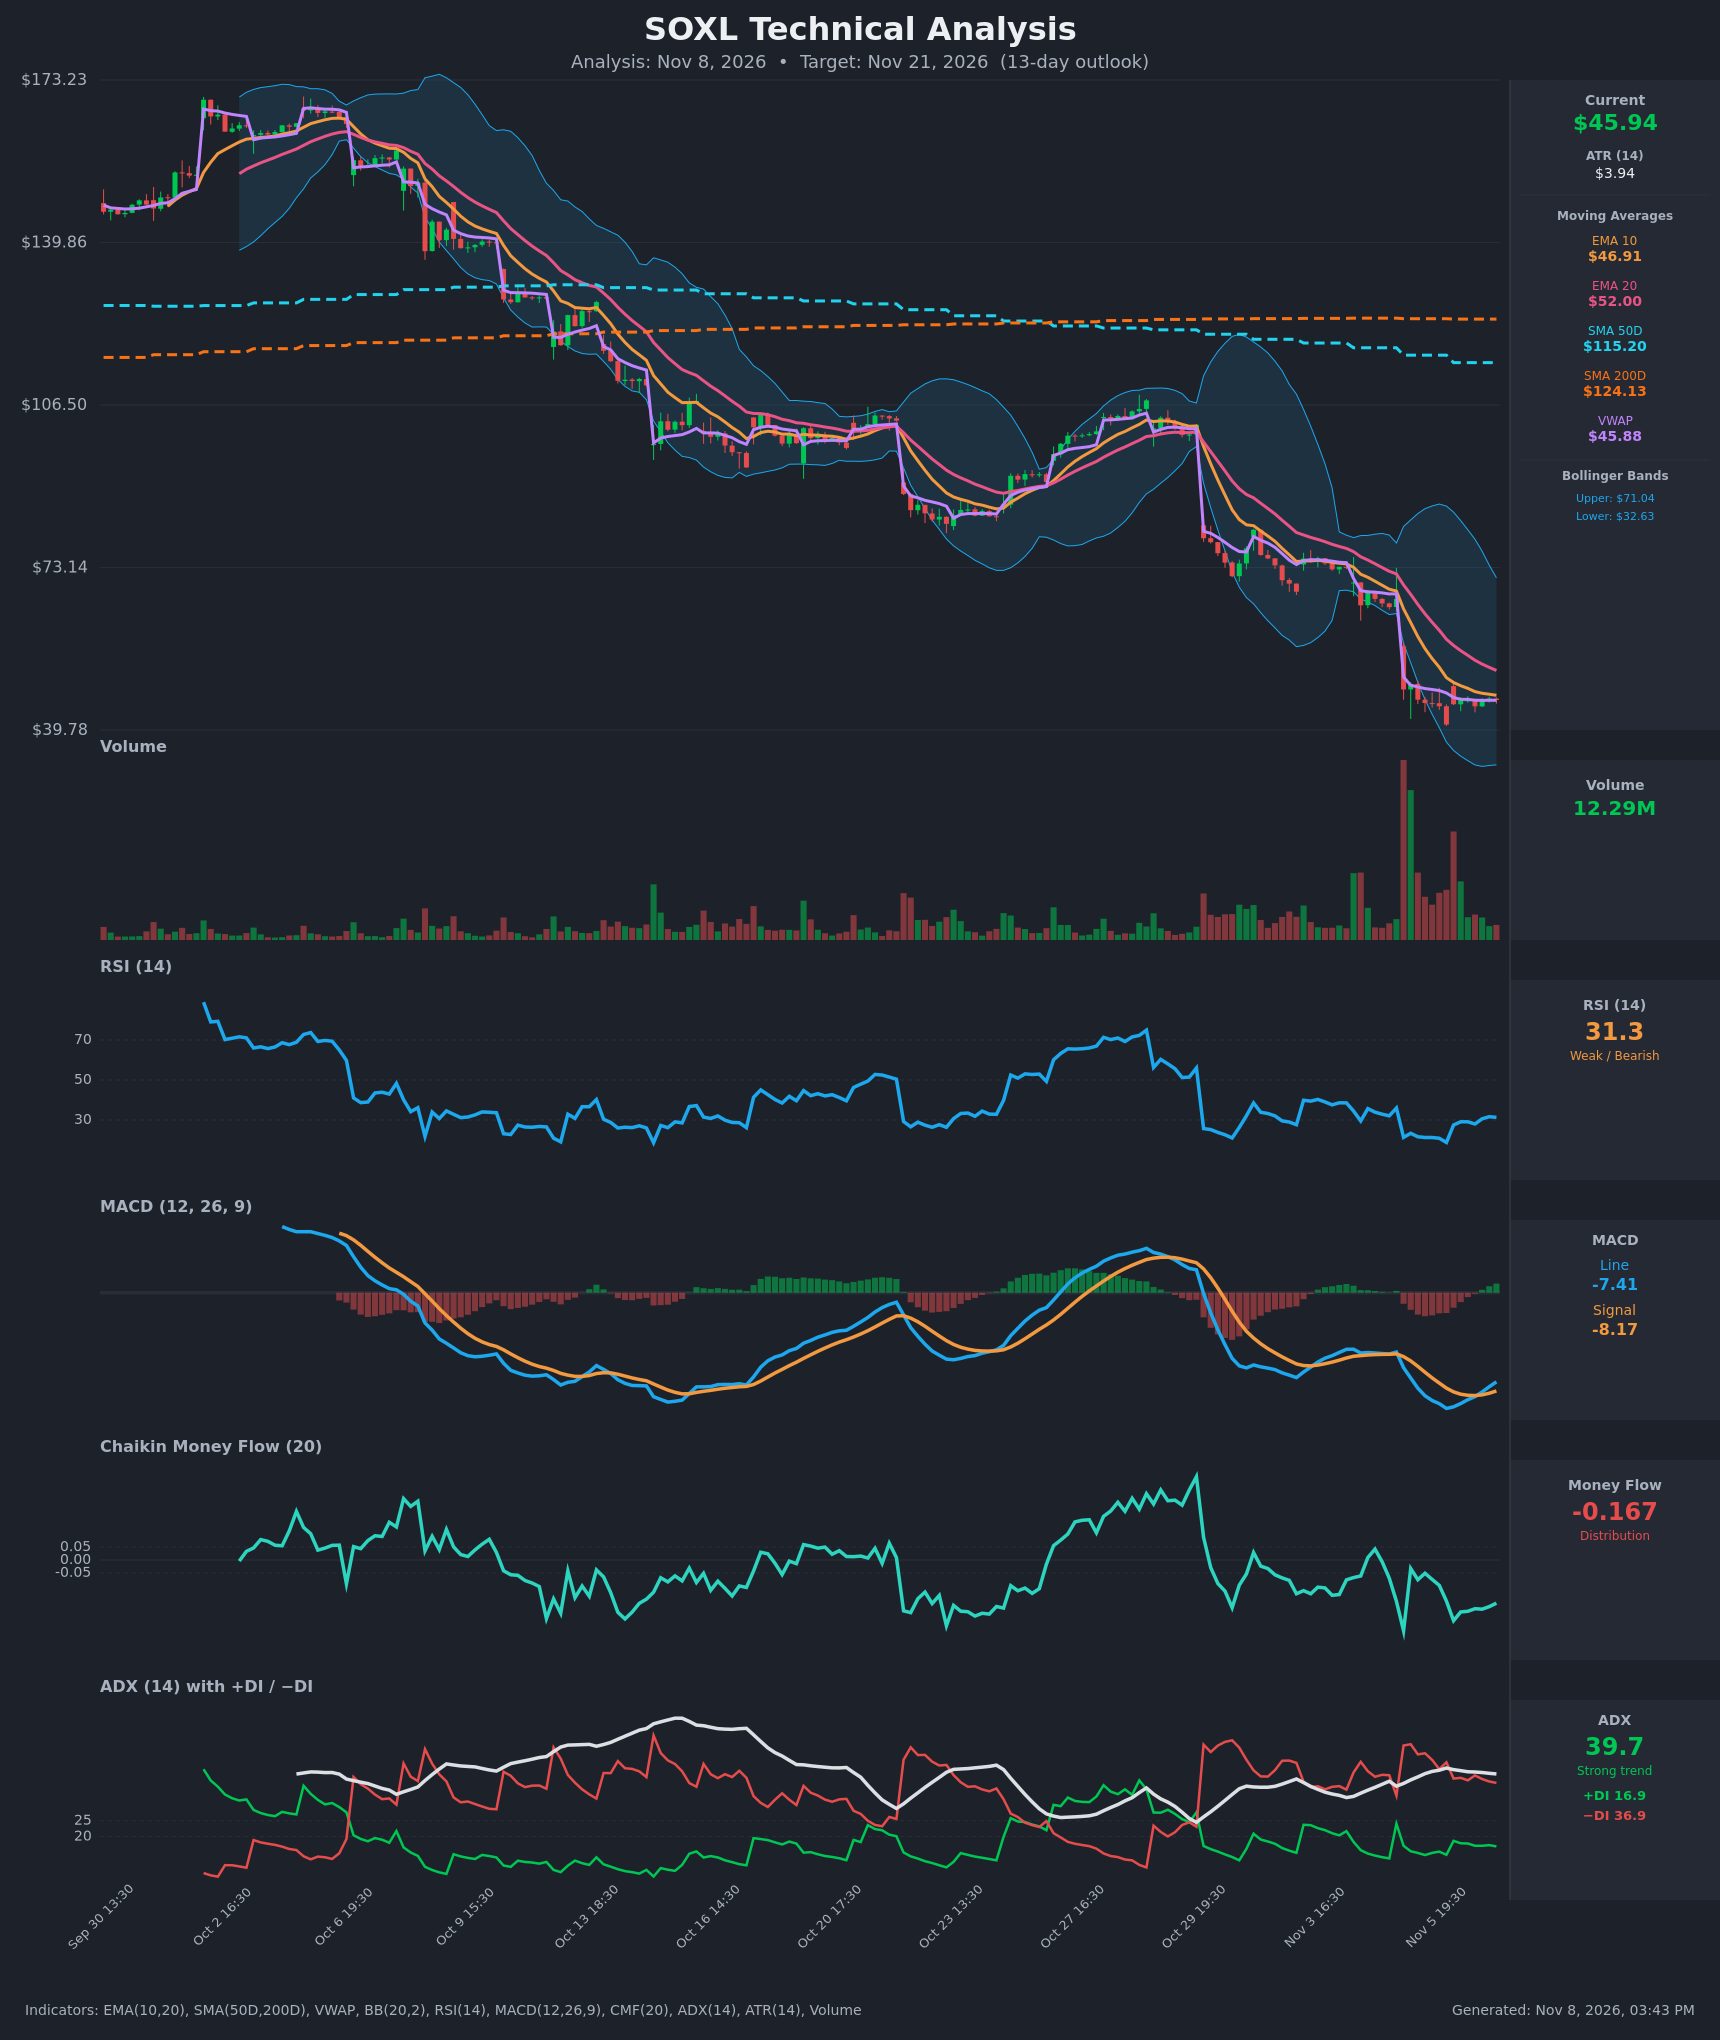
Analysis
TECHNICAL INDICATORS
- RSI (14): 31.32, up from a capitulation low of 18.8 on Nov 5 and now just above the 30 oversold line. Momentum is improving, but it has not reclaimed 50, and every bounce this year has failed in the 30-40 zone. [Neutral]
- 20 EMA: $52.00, well above price. EMA10 ($46.91) is also above price and has been below EMA20 since early November. Both are falling and act as overhead resistance. [Bearish]
- MACD: Line -7.41 is above signal -8.17, a bullish crossover that occurred around Nov 6 18:30, and the histogram has turned slightly positive. Both lines are deep below zero, so this is a relief bounce in a downtrend and not a trend reversal. [Neutral]
- Bollinger Bands (20): Upper $71.04, lower $32.63, midline about $51.8. The bands are very wide after the Nov 5 gap. Price sits in the lower half, below the midline, with about $13 of room to the lower band, so it is not stretched at the band. [Bearish]
- CMF (20): -0.167, well below -0.05 and negative for most of the past two weeks. Sellers still dominate volume flow, and the small recovery since Nov 5 has not produced any accumulation. [Distribution]
- ADX (14): 39.7 with -DI 36.9 far above +DI 16.9. ADX is well above 25 and has held 36-41 since the gap, so this is a strong bearish trend. ADX is flattening slightly, which suggests a pause but not an end. [Strong Trend - Bearish]
- Volume: 12.29M, far below the capitulation spike on Nov 5. Volume has faded during the sideways drift at $44-46. Quiet consolidation after a sharp drop usually leads to continuation, but it can also mark seller exhaustion. [Neutral / fading]
- VWAP: $45.88, essentially equal to price ($45.94). Buyers and sellers are balanced at this level in the short term. [Neutral]
- SMA50D / SMA200D: $115.20 / $124.13. The death cross is long established and price is about 63% below the SMA200D, a deeply entrenched long-term downtrend. [Bearish]
DIVERGENCES & TRENDS
- Bullish divergence (short-term): RSI made a higher low (~28 on Nov 6 versus 18.8 on Nov 5) while price held roughly flat at $44.6-46.2. MACD also crossed up. This points to a relief bounce, not a confirmed reversal.
- Bearish trend structure: Price makes lower highs and lower lows on the larger timeframe. EMA10 is below EMA20, both are below SMA50D and SMA200D, and the SMA50D is below the SMA200D. The Nov 5 gap from about $66 to $48 broke the prior support zone.
- Directional indicators: -DI has been above +DI throughout the decline, and +DI is only 16.9, so no bullish DI crossover is close.
- CMF: It has stayed negative and has not confirmed the MACD bounce. Without volume support, bounces are likely to fade near the EMAs.
- Price compression: Closes in the last 10 bars sit in a tight $44.6-$46.2 band, which is a pause after a vertical drop.
CHART PATTERNS
- Bearish Pennant / Bearish Flag (continuation): After the vertical drop from about $66 to $41-48, price has been drifting sideways in a narrow band with fading volume. This is the closest match to the diagram's bearish continuation patterns. A break below about $44.60 (and especially $40.90) would project a measured move lower, with a first target around $40 and an extension toward the low-to-mid $30s near the lower Bollinger Band ($32.63).
- Possible base (Double Bottom-like): The $40.90 and $44.6 lows could form a base, but a Double Bottom needs a break of the neckline near $49 on rising volume. That has not happened, so this is a lower-probability read.
- Gap and capitulation: The Nov 5 gap and volume spike mark a washout. Such washouts often retest the low before any durable bottom forms.
POTENTIAL SCENARIOS
- Scenario 1: Bearish Pennant Continuation Lower — Price fails at the falling EMA10 and EMA20, loses the $44.60 consolidation floor, and retests the Nov 5 low. Strong -DI dominance and negative CMF support this. Trigger: hourly close below $44.60 with rising volume. Target: $40.90, then $38-40 (extension toward $35). Invalidation: close above $49.22 (the Nov 5 bounce high). (50% probability)
- Scenario 2: Bullish Oversold Relief Bounce — The RSI and MACD bounce extends, and price reclaims EMA10 and rallies toward EMA20 and the Nov 5 gap-fill zone. Trigger: close above $47.00 with volume expansion and CMF turning up. Target: $49-52 (EMA20 near $52). Invalidation: close back below $44.60. (35% probability)
- Scenario 3: Neutral Range Chop — Price stays pinned between about $41 and $48 as ADX cools and indicators stay mixed. Trigger: no break of $44.60 or $47.00 for several sessions. Target: roughly $44-47. Invalidation: a decisive close outside $41-$49. (15% probability)
PRICE TARGETS
- Target Price: $43.20 (13-day outlook)
- Expected Range: $41.50 to $47.50 (width $6.00, about 13% of current price)
- Key Levels: Support at $40.90, Resistance at $49.22
OVERALL BIAS
OVERALL BIAS: BEARISH - The strong downtrend (ADX 39.7, -DI 36.9 vs +DI 16.9), persistent distribution (CMF -0.167), and price below all key moving averages outweigh the oversold RSI bounce and MACD crossover, which sit deep in negative territory. The tight consolidation after the gap resembles a bearish pennant, so a drift back toward the $41-43 area is more likely than a sustained recovery.
This is educational analysis and not financial advice.