AMD 20-day bearish forecast — Nov 8, 2026
- Bias: Bearish
- Timeframe: 20 days (made Nov 8, 2026, target date Nov 27, 2026)
- Price at analysis: $449.04
- Price target: $432.00
- Expected range: $385.00 – $495.00
- Result: Pending — graded after the close on Nov 27, 2026
Get a free AI analysis of AMD today
Analysis
TECHNICAL INDICATORS
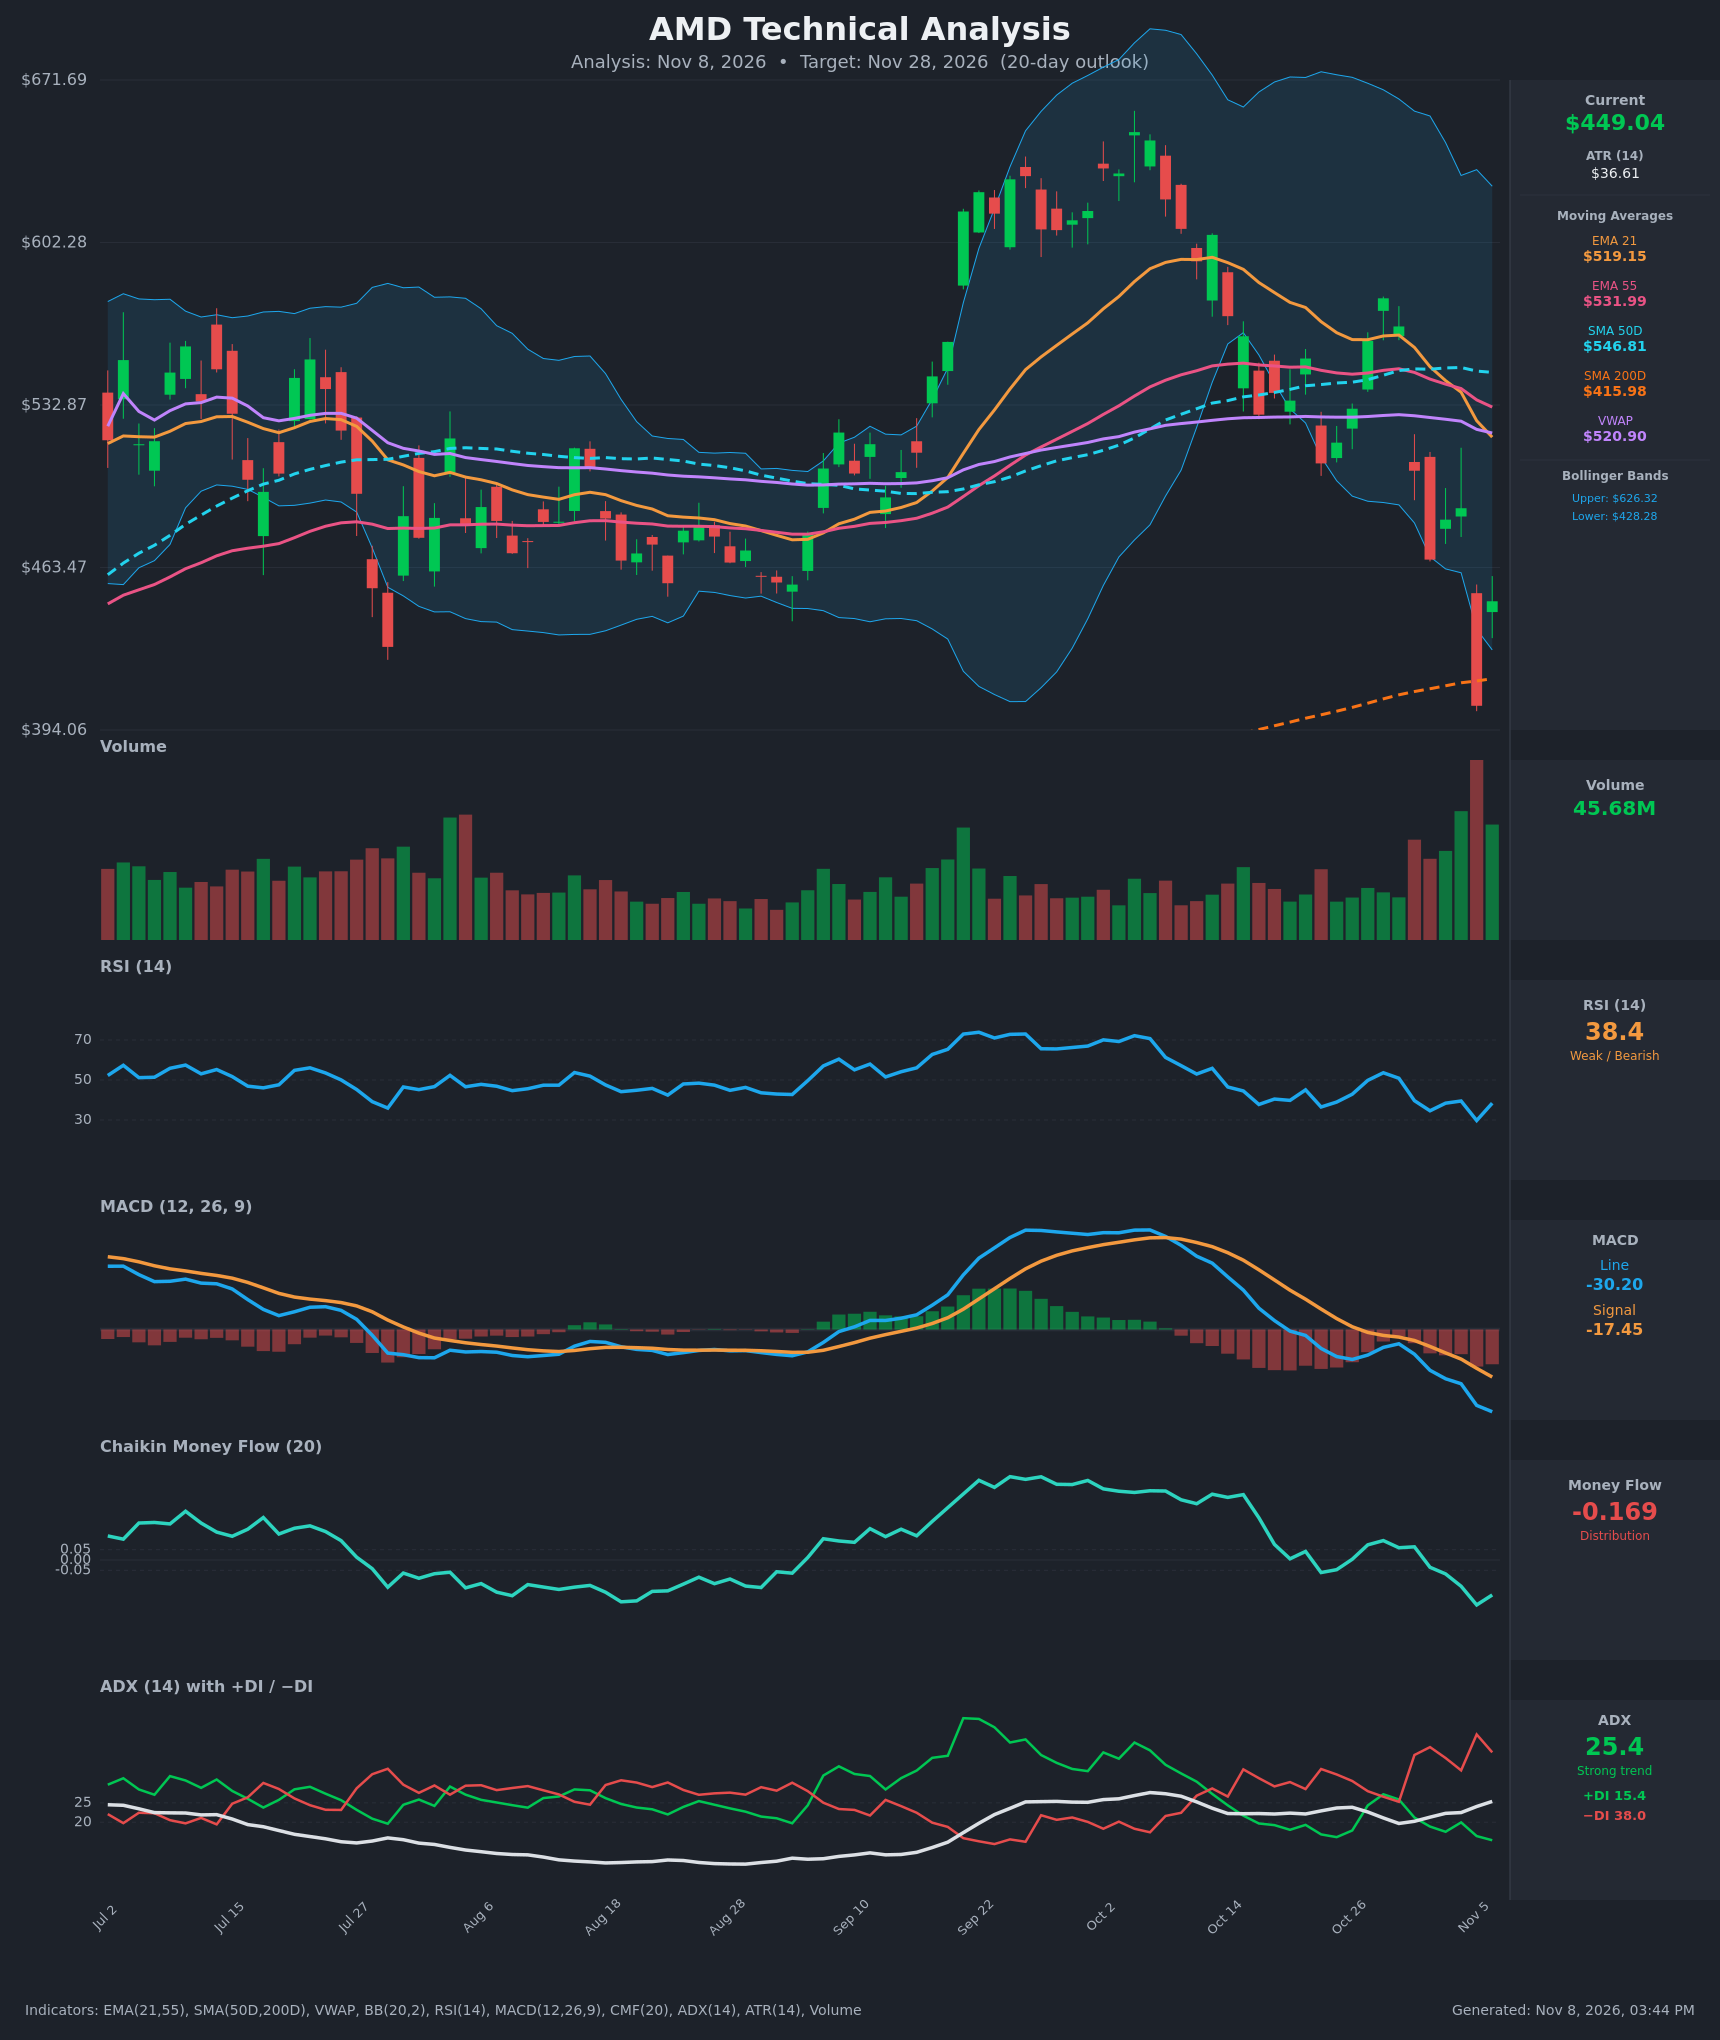
- RSI (14): 38.41, in weak territory just above oversold. It bounced from 29.7 on Nov 5, but the broader trend since the Oct 28 reading of 53.6 is down, with lower highs. [Bearish]
- 20 EMA: The EMA 21 is $519.15 and price at $449.04 is about 13.5% below it. The EMA is falling steeply and acts as overhead resistance. EMA 21 is also below EMA 55 ($531.99), a bearish cross that occurred around Nov 4. [Bearish]
- MACD: Line -30.20 is below signal -17.45, with a widening negative histogram of about -12.8. It crossed down on Oct 20 and has been accelerating lower, with no sign of a bottom. [Bearish]
- Bollinger Bands (20): Upper $626.32, lower $428.28, midline about $527. Price sits in the lower quarter of the band after tagging and piercing the lower band on Nov 5 ($404.40), then bounced back inside. A mean-reversion bounce is plausible, but the bands are wide and in a downtrend price can walk the lower band. [Neutral]
- CMF (20): -0.169, well below the -0.05 threshold and near the lows of its range, showing persistent distribution and selling pressure. [Distribution]
- ADX (14): 25.4 and rising, with -DI at 38.0 far above +DI at 15.4. This is a strong, established downtrend. [Strong Trend - Bearish]
- Volume: 45.68M on the latest bar, with the Nov 5 breakdown candle on the highest volume of the period. The heavy volume on the red candle shows capitulation or a genuine distribution breakdown, and the Nov 6 bounce came on high but lower volume. [Bearish on the breakdown, with possible short-term exhaustion]
DIVERGENCES & TRENDS
- No bullish RSI divergence: RSI made a low of 29.7 on Nov 5 against a price low of $404.40, then both bounced. Price is now at $449 with RSI at 38.4, so there is no clear divergence yet.
- Trend deterioration: MACD has been falling for roughly 3 weeks and is at its lowest level of the whole chart. CMF has turned from strongly positive (the Sep-Oct rally) to deeply negative, confirming distribution after the Oct 2 high near $660.
- Crossovers:
- EMA21 crossed below EMA55 (bearish).
- Price is below the VWAP ($520.90), EMA21, EMA55 and SMA50D ($546.81).
- SMA50D remains above SMA200D ($415.98), so there is no death cross, but the 50D is flattening and rolling over.
- -DI has been above +DI since Oct 30, with the gap widening.
- Long-term support: Price is above the rising SMA200D at $415.98, about 7% below. This is the key support. The Nov 5 wick to $404 briefly pierced it intraday.
CHART PATTERNS
- Bearish Rising Wedge / Head and Shoulders-like top: The Sep-Oct rally to about $660, followed by a lower high near $578 (Oct 28) and a breakdown through the $460-$500 area, resembles a Bearish Head and Shoulders / Double Top reversal structure. The measured move from the Oct peak toward the neckline area implies continued downside, with the SMA200D near $416 as the first major target.
- Failed bounce: The Oct 28 rally to $578 failed at the SMA50D/EMA55 cluster, and the following sell-off formed lower highs, consistent with a bearish trend continuation.
- Significance: The Nov 5 candle is a large high-volume breakdown. A small consolidation or bear flag may be forming around $449-$490 before the next leg. The initial target is the $404-$416 zone, and a break below it could extend toward $370-$380.
POTENTIAL SCENARIOS
- Scenario 1: Bearish Trend Continuation — The strong downtrend (ADX 25+, -DI dominant, CMF negative, MACD widening) continues. Price fails at the $480-$500 area, retests the Nov 5 low and SMA200D, and may break below. Trigger: rejection at $480-$495 or a close below $425. Target: $395-$410, with an extension toward $375. Invalidation: a daily close above $520 (EMA21 and VWAP). (50% probability)
- Scenario 2: Bullish Oversold Relief Bounce — RSI near 30 on Nov 5, a Bollinger lower band tag, and the SMA200D support produce a mean-reversion bounce toward the declining EMA21 and the midline area. Trigger: a close above $490 on rising volume. Target: $510-$525 (EMA21/VWAP). Invalidation: a close below $404. (30% probability)
- Scenario 3: Neutral Basing Range — Price chops between the $405 low and about $500 as the selling is absorbed near the SMA200D. Trigger: repeated holds above $415 with tightening ranges. Target: $430-$480. Invalidation: a close below $400 or above $520. (20% probability)
PRICE TARGETS
- Target Price: $432.00 (20-day, slight downside as the trend likely drifts lower with a possible test of the SMA200D, though bounces are likely along the way)
- Expected Range: $385.00 to $495.00 (width $110, about 24.5% of the current price. This is wider than the 14-21 day guideline of 8-12% because the ATR of $36.61 implies large daily moves, about 8% of price per day, so a 20-day range must be wider to be realistic.)
- Key Levels: Support at $416.00 (SMA200D, with the Nov 5 low at $404.40 beneath it), Resistance at $519.00 (EMA21/VWAP area, with minor resistance at $490)
OVERALL BIAS
OVERALL BIAS: BEARISH - ADX at 25.4 with -DI (38.0) far above +DI (15.4), negative CMF (-0.169), a widening bearish MACD, and price below all key short and medium-term moving averages and VWAP point to continued downside. The oversold RSI and the SMA200D support at about $416 may cause bounces, but the evidence favors a drift lower.
This is educational analysis and not financial advice.