XLF 13-day bearish forecast — Nov 8, 2026
- Bias: Bearish
- Timeframe: 13 days (made Nov 8, 2026, target date Nov 20, 2026)
- Price at analysis: $57.16
- Price target: $56.40
- Expected range: $54.80 – $59.10
- Result: Pending — graded after the close on Nov 20, 2026
Get a free AI analysis of XLF today
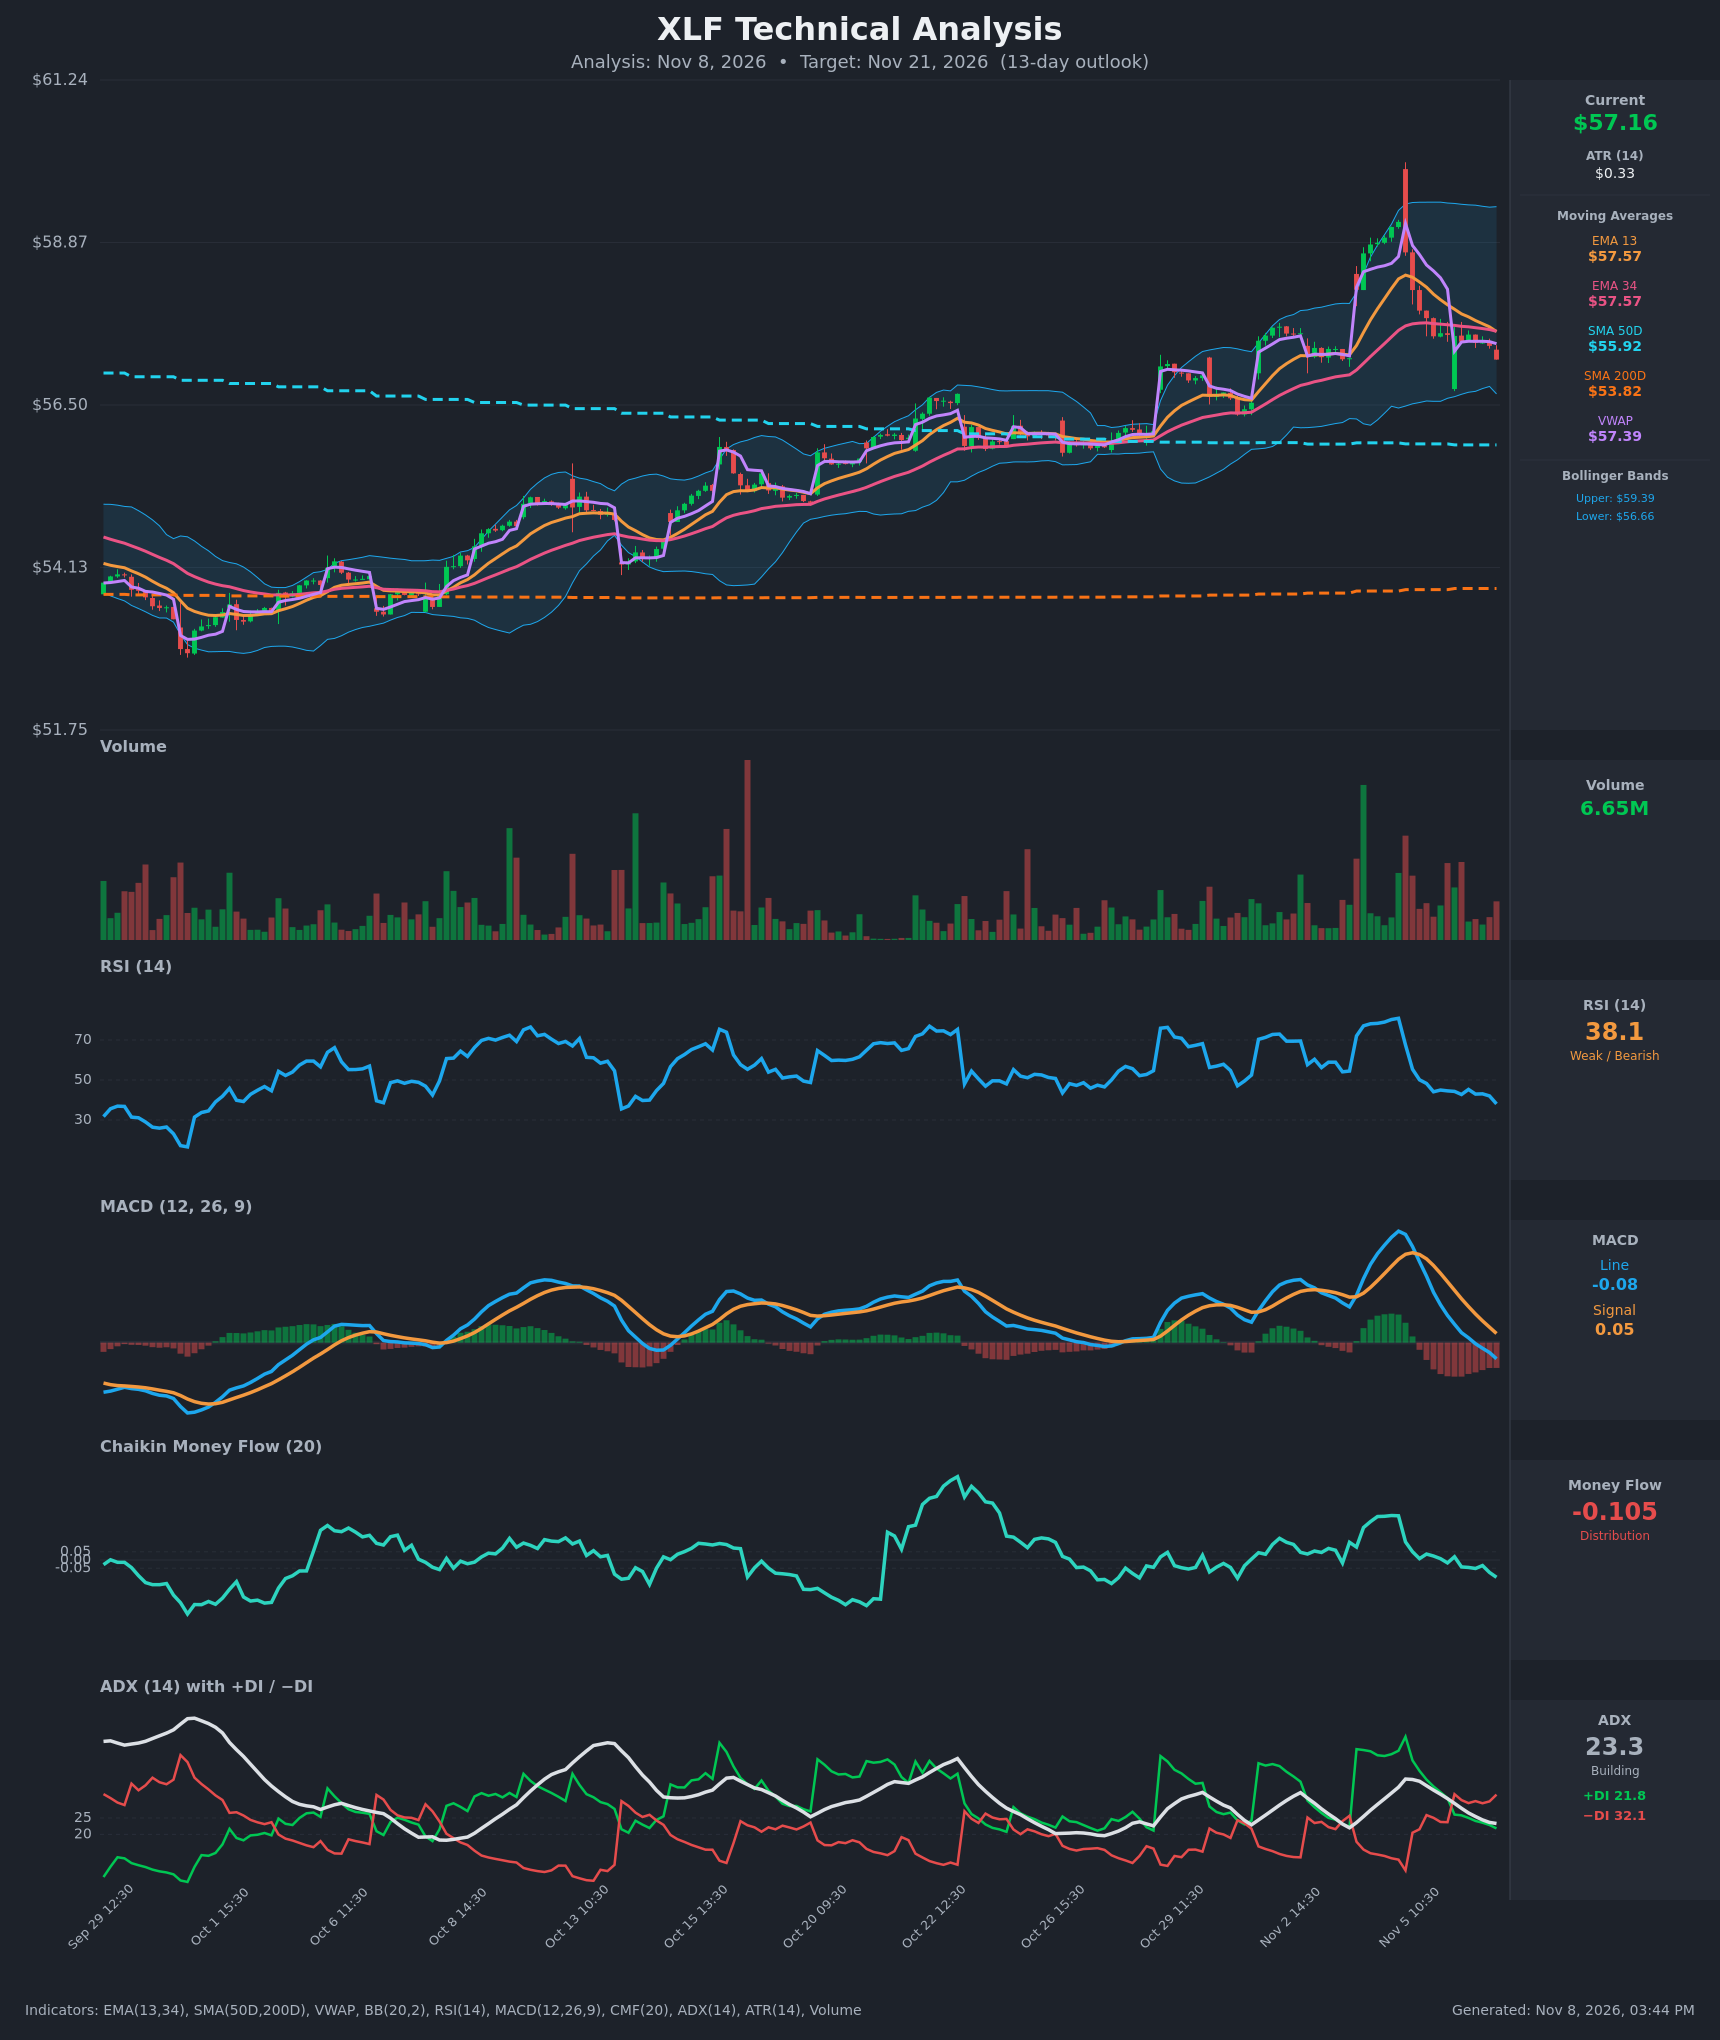
Analysis
TECHNICAL INDICATORS
- RSI (14): 38.05, down from 80.9 on Nov 4 and now near the oversold zone but not yet below 30. Momentum is falling and the RSI has failed to hold 50. [Bearish]
- 20 EMA (EMA 13/34 shown): EMA13 is $57.57 and EMA34 is $57.57, so the two are converging and about to cross bearishly. Price at $57.16 is below both, and the cluster is now overhead resistance. [Bearish]
- MACD: The line (-0.085) crossed below the signal (+0.048) around Nov 6 12:30 and is now below zero. The histogram is negative and expanding. This is a fresh bearish crossover with downward momentum. [Bearish]
- Bollinger Bands (20): Upper is $59.39, lower is $56.66, so price is in the lower portion of the bands, about $0.50 above the lower band. The bands are wide after the spike to ~$59. A walk down the lower band or a bounce off it are both possible. [Neutral/Slightly Bearish]
- CMF (20): -0.105, below the -0.05 threshold. It has turned negative after being positive earlier, which points to distribution. [Distribution]
- ADX (14): 23.3 and falling from the mid-30s, so the trend is weak to moderate. −DI (32.1) is above +DI (21.8), and the +DI/−DI bearish crossover happened on Nov 6 09:30. Bears control the short-term direction, but the trend is not yet strong. [Weak-to-Moderate Trend, Bearish]
- Volume: 6.65M, near average with no capitulation spike. The heavy red bars during the Nov 4-5 reversal show selling pressure, and the current pullback is on average volume. [Mildly Bearish]
DIVERGENCES & TRENDS
- There is no clear bullish divergence yet. RSI and price are both making lower readings, so momentum confirms the decline.
- RSI collapsed from 80.9 to 38 in about 2 sessions. This is a sharp mean-reversion from an overbought blow-off, and price tagged the upper Bollinger Band area (~$59.2) before reversing.
- EMA13 is falling toward EMA34 and a bearish EMA cross is imminent (57.57 vs 57.57).
- MACD and DI both crossed bearishly on Nov 6. CMF is rolling over into distribution.
- The longer-term structure is still bullish. Price is above SMA50 ($55.92) and SMA200 ($53.82), and SMA50 is well above SMA200 (the golden cross is already in place). The medium-term uptrend is intact, but short-term momentum has turned down.
- Price is below VWAP ($57.39), which means sellers are in control intraday.
CHART PATTERNS
- The chart does not show a clean textbook pattern. The closest match is a post-spike pullback resembling a Bearish Flag/Descending channel within a larger uptrend, with the Nov 4 spike acting as a rejection (a mini double-top-style reversal around $59).
- The lower highs after the peak and the failure to hold the EMA cluster support a retracement toward prior breakout levels.
- Prior consolidation sat around $56.0-$56.7, which is where the Nov 3 gap-up originated. That zone, plus SMA50 at $55.92, forms a logical downside magnet.
- Pattern-based measured move: a retracement of roughly 40-60% of the Oct 29-Nov 4 leg (~$56.2 to $59.2) points to $56.0-$57.0.
POTENTIAL SCENARIOS
- Scenario 1: Bearish Pullback to Gap/SMA50 Support — Price stays capped under the EMA13/34 and VWAP cluster. The bearish MACD, DI and CMF signals extend the retracement toward the lower Bollinger Band and the prior breakout zone. Trigger: a failure to reclaim $57.57 and a break below $56.66. Target: $56.00-$56.50. Invalidation: a daily close above $57.60 with MACD turning up. (50% probability)
- Scenario 2: Bullish Dip-Buy Rebound — The long-term uptrend (above SMA50 and SMA200) attracts buyers near the lower band, with RSI in the high 30s. Price reclaims the EMA cluster and retests the highs. Trigger: a bounce off $56.66 and a close above $57.60. Target: $58.30-$59.00. Invalidation: a close below $56.50. (28% probability)
- Scenario 3: Neutral Range Chop — Price consolidates between $56.50 and $57.60 as the ADX fades below 20. Trigger: ADX declining and several inside days. Target: $56.90-$57.30. Invalidation: a break outside the $56.30-$57.80 range. (22% probability)
PRICE TARGETS
- Target Price: $56.40 (13-day horizon, Nov 21, 2026)
- Expected Range: $54.80 to $59.10 (width $4.30 ≈ 7.5% of current price, scaled for a 13-day horizon)
- Key Levels: Support at $55.92 (SMA50, with the lower Bollinger Band at $56.66 as minor support), Resistance at $57.57 (EMA13/34 cluster)
OVERALL BIAS
OVERALL BIAS: BEARISH - Price has broken below the EMA13/34 and VWAP after a blow-off reversal. MACD and DI have crossed bearishly, CMF shows distribution, and RSI is falling. The larger uptrend (above SMA50/200) should limit the downside to around the SMA50 and the prior breakout zone near $56.
This is educational analysis and not financial advice.