AAL 20-day bullish forecast — Nov 8, 2026
- Bias: Bullish
- Timeframe: 20 days (made Nov 8, 2026, target date Nov 27, 2026)
- Price at analysis: $13.18
- Price target: $13.65
- Expected range: $12.45 – $14.00
- Result: Pending — graded after the close on Nov 27, 2026
Get a free AI analysis of AAL today
Analysis
TECHNICAL INDICATORS
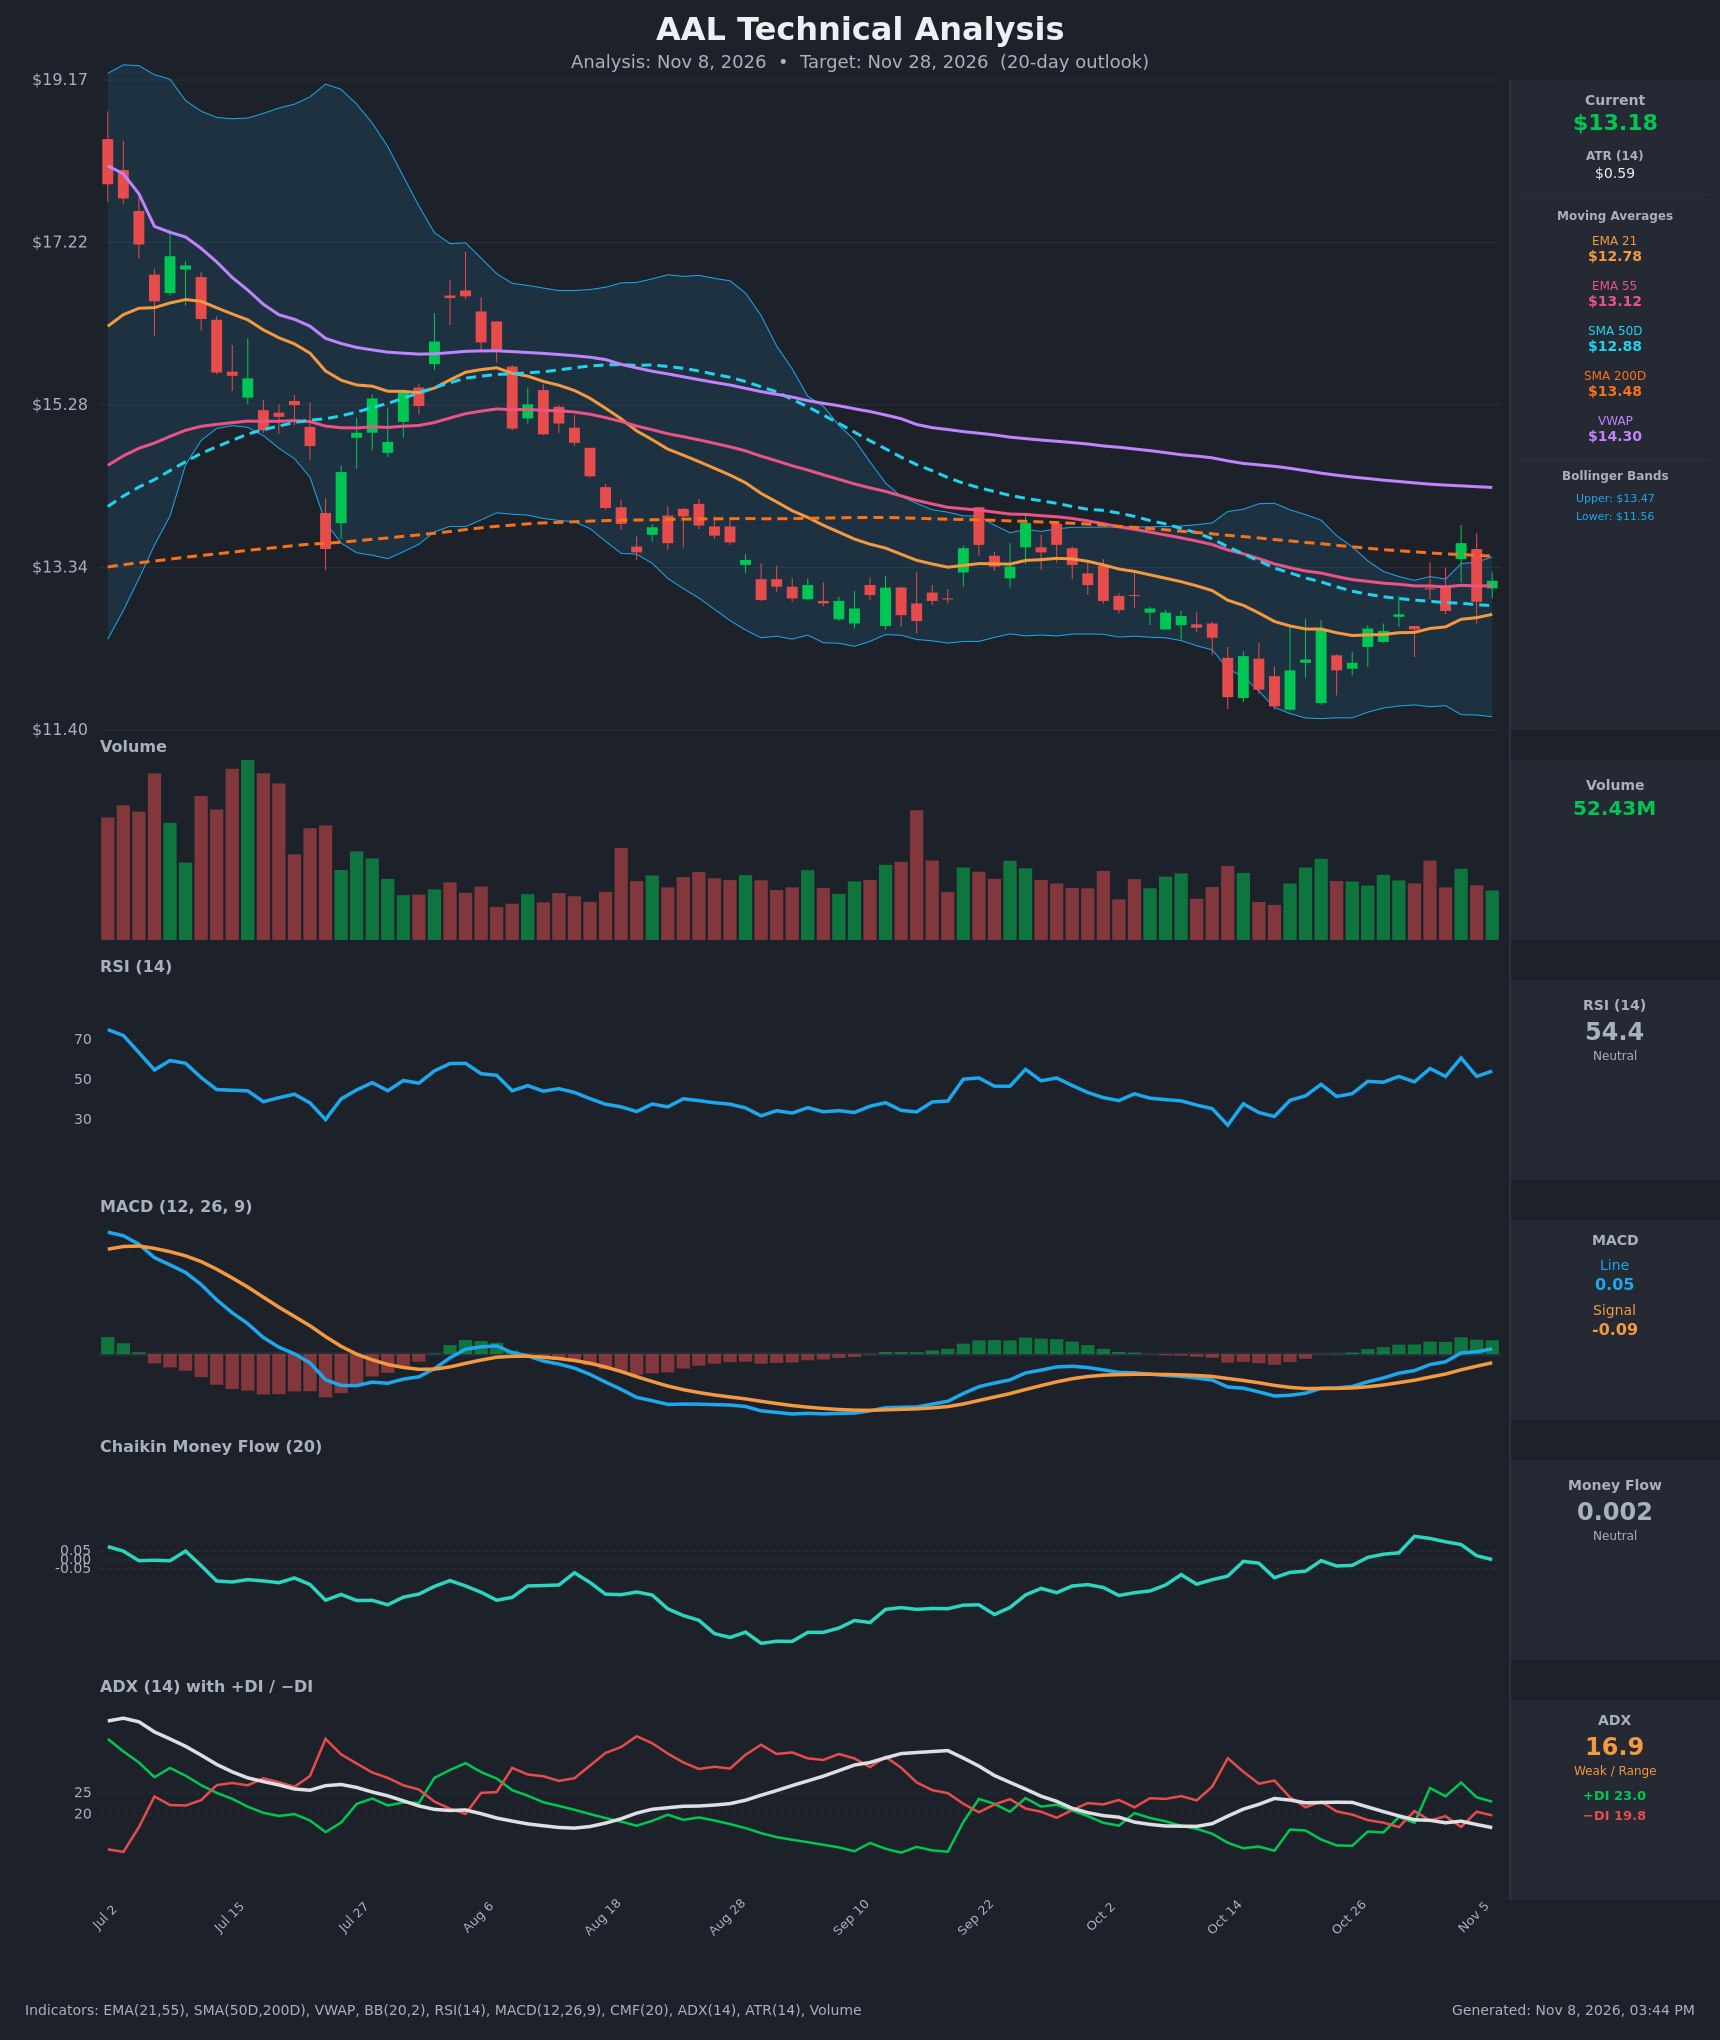
- RSI (14): 54.45, neutral and recovering from the 27-31 oversold zone in mid-October. It has been above 50 on most bars since Nov 2 but failed to hold the 61 spike on Nov 4, so momentum is improving without being strong. [Bullish]
- 20 EMA (EMA 21 = $12.78): Price at $13.18 is about 3% above it. The EMA has flattened and turned up from $12.53, so it now acts as dynamic support. EMA21 is still below EMA55 ($13.12), so there is no bullish EMA crossover yet, but the gap is narrowing. [Bullish]
- MACD: The line (0.053) crossed above the signal (-0.086) around Nov 4 and moved into positive territory. The histogram is positive and has been rising for about 10 sessions. This is a fresh bullish crossover, though it is still near the zero line. [Bullish]
- Bollinger Bands (20): Upper $13.47, lower $11.56, midline about $12.51. Price sits in the upper half of the bands (%B ≈ 0.85) and is testing the upper band after a sharp bounce from the lower band in October. The bands are narrowing, so a volatility squeeze is forming, and the upper band is a near-term cap. [Neutral]
- CMF (20): 0.002, in the neutral zone (±0.05). It has faded from a peak near +0.13 on Oct 30, so buying pressure is eroding during the rally. [Neutral]
- ADX (14): 16.9 and falling, which means a weak trend or range. +DI (23.0) is above −DI (19.8), so bulls have a slight edge after the early-November bullish DI crossover, but conviction is low. [Weak Trend, slight bullish lean]
- Volume: 52.43M, roughly average, with no obvious expansion on the bounce. Green volume bars have modestly outnumbered red since mid-October, but the rally lacks a breakout surge. [Neutral to mildly supportive]
Moving-average context:
- Price is above SMA50D ($12.88) and EMA21, but below SMA200D ($13.48) and VWAP ($14.30).
- The SMA50 is below the SMA200, so the long-term structure is still a death-cross downtrend.
DIVERGENCES & TRENDS
- Positive divergence (resolved): In October price made a lower low near $11.6-11.7 while RSI printed a higher low relative to the September lows, and MACD stopped making new lows. This foreshadowed the current rebound.
- Fading CMF: CMF has dropped from +0.13 to about 0 while price pushed higher, a mild bearish divergence that warns of a lack of sponsorship at $13.4-13.6.
- Crossovers:
- The MACD bullish cross is confirmed.
- The +DI/−DI bullish cross is in place.
- Price reclaimed the EMA21 and SMA50.
- Price is hovering at EMA55 ($13.12).
- Price has not yet closed above SMA200 ($13.48).
- Trend: The long-term downtrend from $19 is still intact, but momentum indicators have turned up. ADX is falling, so the move is more of a base and recovery than a new trend.
CHART PATTERNS
- Bullish base / Falling Wedge-style reversal (reference diagram): Lower highs and lower lows from July compressed into the October low, followed by a V-shaped recovery. This resembles a Bullish Falling Wedge or a double-bottom-like base, with the Oct 14-19 lows near $11.6-11.7 as the floor.
- Neckline / resistance: The $13.45-13.65 zone is the key level, formed by SMA200, the upper Bollinger Band and the Nov 4 spike high. A confirmed break targets the VWAP/$14.30 area, then the $15 zone.
- Short-term: The last two weeks form a rising-low consolidation between about $12.1 and $13.6, resembling a small Ascending Triangle under $13.5. That is a mild bullish continuation bias, but ADX is weak, so a failure back into the range is plausible.
POTENTIAL SCENARIOS
- Scenario 1: Bullish SMA200 Breakout — Price absorbs the $13.48-13.65 resistance, helped by the MACD cross and +DI lead, and rotates toward VWAP. Trigger: daily close above $13.65 on rising volume. Target: $14.00-$14.30. Invalidation: close back below $12.78 (EMA21). (50% probability)
- Scenario 2: Neutral Range Chop — Price keeps oscillating beneath SMA200 and above SMA50 because ADX is weak and CMF is flat. Trigger: repeated rejections near $13.5 with support holding around $12.8-12.9. Target: $12.80-$13.40. Invalidation: close outside $12.60-$13.70. (25% probability)
- Scenario 3: Bearish Rejection — The rally fails at SMA200 and the upper band, CMF turns negative, and price loses the moving-average cluster. Trigger: close below $12.78 with MACD histogram rolling over. Target: $12.00, then $11.60. Invalidation: close above $13.70. (25% probability)
PRICE TARGETS
- Target Price: $13.65 (20-day, about +3.6%)
- Expected Range: $12.45 to $14.00 (width $1.55 ≈ 11.8% of current price, consistent with the 14-21 day guideline)
- Key Levels: Support at $12.88 (SMA50D, with EMA21 near $12.78 below it), Resistance at $13.48 (SMA200D, then $13.65 and VWAP at $14.30)
OVERALL BIAS
OVERALL BIAS: BULLISH - A fresh MACD bullish crossover, +DI over −DI, price reclaiming the EMA21 and SMA50, and a base after the October washout favor a grind higher. The modest conviction reflects weak ADX, flat CMF, and heavy resistance at SMA200 and VWAP.
This is educational analysis and not financial advice.