CRWV 20-day bearish forecast — Nov 8, 2026
- Bias: Bearish
- Timeframe: 20 days (made Nov 8, 2026, target date Nov 27, 2026)
- Price at analysis: $46.40
- Price target: $43.00
- Expected range: $37.00 – $53.00
- Result: Pending — graded after the close on Nov 27, 2026
Get a free AI analysis of CRWV today
Analysis
TECHNICAL INDICATORS
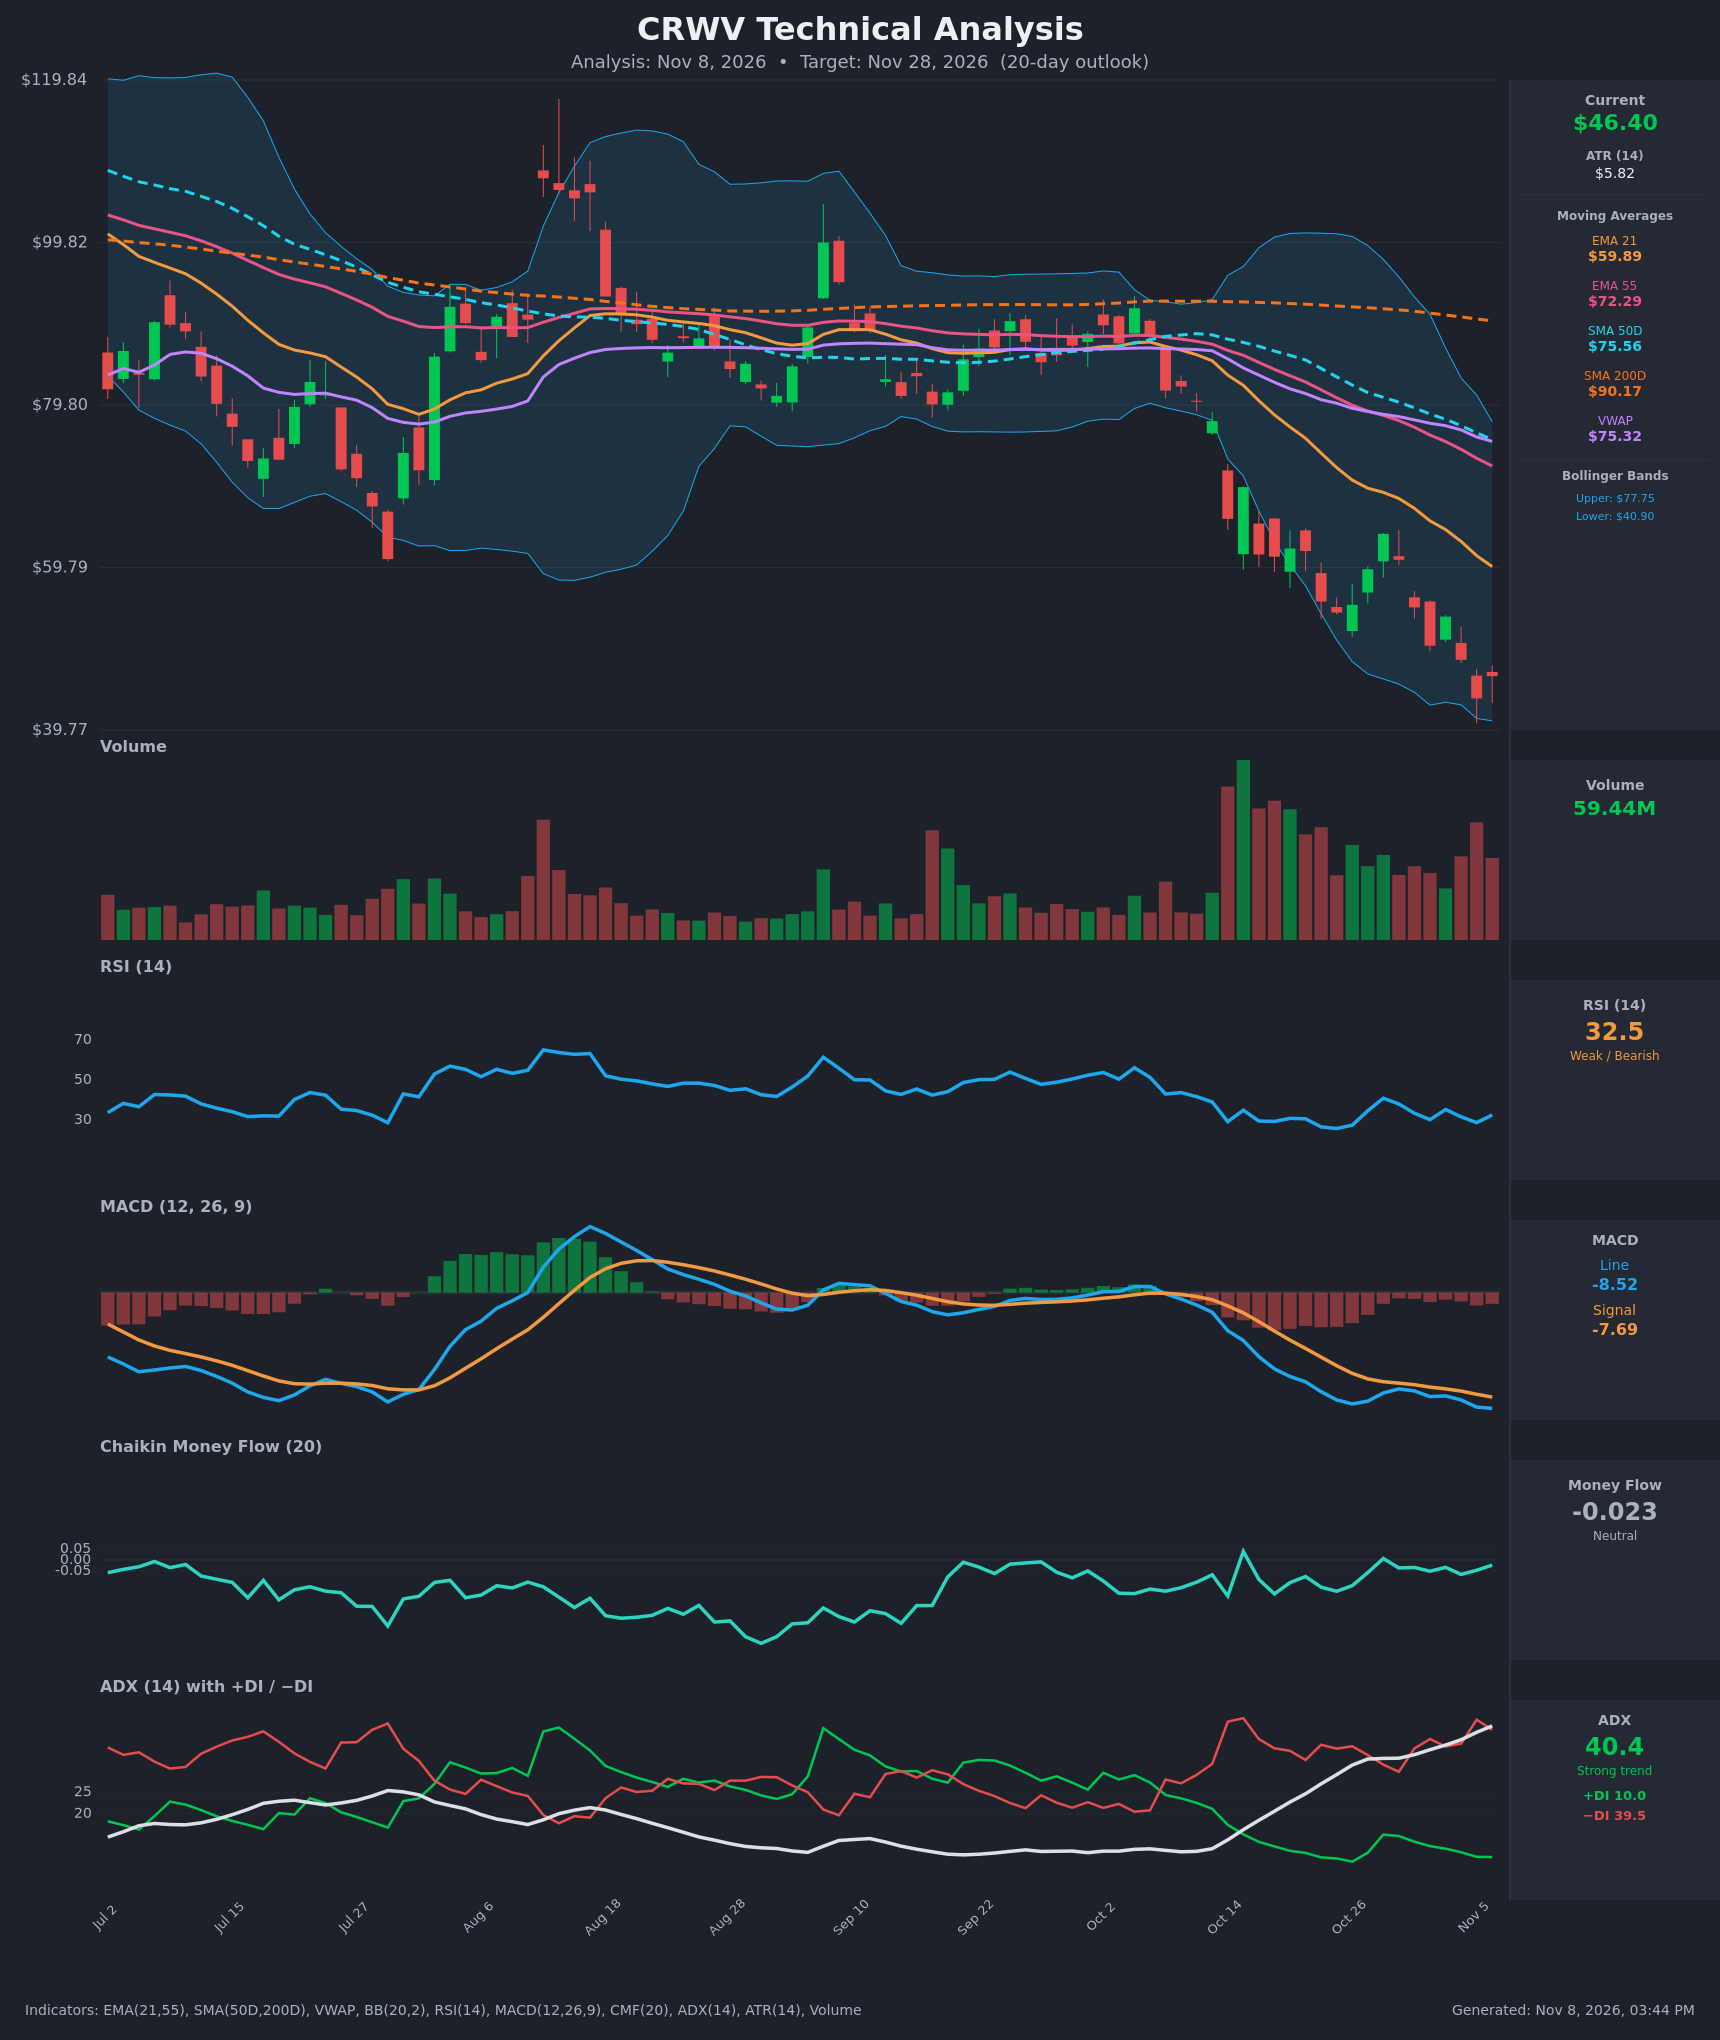
- RSI (14): 32.51, just above the oversold line at 30. It has been stuck between 26 and 41 for about a month and has not made a higher low, so momentum is weak with no confirmed turn. [Bearish]
- 20 EMA: The 21 EMA is at $59.89, about 29% above price at $46.40. It has fallen steadily from $78.59 over 15 bars and acts as heavy overhead resistance. EMA21 is also well below EMA55 ($72.29). [Bearish]
- MACD: The line (-8.52) is below the signal (-7.69), and the gap widened over the last several bars. The histogram is negative and still expanding. MACD has been below the signal since the mid-October breakdown, so there is no bullish crossover yet. [Bearish]
- Bollinger Bands (20): The bands run $40.90 to $77.75, and price sits in the lower third near the lower band after riding it for several bars. The bands are wide, so volatility is elevated. Price has not closed decisively below the lower band, so a bounce toward the midline (about $59) is possible, but a persistent downtrend can keep walking the band. [Bearish]
- CMF (20): -0.023, inside the neutral zone (±0.05). It improved from -0.155 on Oct 19, so selling pressure is fading but there is no accumulation. [Neutral]
- ADX (14): 40.4 and rising, a strong trend. −DI at 39.5 is far above +DI at 10.0, so bears fully control. ADX is still climbing and shows no sign of trend exhaustion. [Strong Trend – Bearish]
- Volume: 59.44M, elevated, with heavy volume on the red candles during the October breakdown and again in the last few bars. Volume is rising into the decline, which confirms selling rather than exhaustion. Price is also below VWAP ($75.32). [Bearish – distribution/confirmation]
DIVERGENCES & TRENDS
- Moving average structure: Price ($46.40) is below EMA21 ($59.89), EMA55 ($72.29), SMA50D ($75.56) and SMA200D ($90.17), a fully bearish stack. EMA21 crossed below EMA55 well before the 15-bar window, and SMA50D is now falling toward SMA200D, which points to a probable death cross if the decline continues.
- RSI divergence: RSI made a lower low at about 25.8 on Oct 23, then a higher low at 30.2 on Nov 2. It is now 32.5 against a price low of $43.66 on Nov 5 (RSI 28.7). This shows mild bullish momentum divergence, but it is not confirmed and is weak against the ADX trend.
- MACD: No bullish crossover. The MACD line keeps making new lows and is below zero, which signals persistent downside momentum.
- ADX/DI: −DI is dominant, +DI is at 10 and ADX is rising, so the trend is accelerating down.
- Price action: Lower highs and lower lows since the October peak near $62–64. Nov 6 bounced to $46.40 from $43.66, a small relief move that does not break the structure.
- Oversold bounces: Prior RSI readings near 26–30 produced only short bounces to about $64 that were sold into the falling EMA21.
CHART PATTERNS
- Bearish continuation / downtrend channel: Since the Oct 14 breakdown, price has formed lower highs and lower lows, resembling a bearish flag/falling channel after the sharp drop from about $80 to $55. The measured move from the flag implies continuation lower.
- Failed rebound: The bounce from $54 to $64 (Oct 23–28) was rejected and looks like a bearish flag/rising-wedge-type pullback. The break below $54 and then $50 confirmed it.
- Possible bullish setup (low confidence): The mild RSI divergence at the lower Bollinger Band could produce a short-term bounce, but there is no double bottom or inverted H&S confirmation yet.
- Targets: A flag-based measured move gives roughly $38–40, near the lower band. Bounce resistance sits at $54–55, then the EMA21 near $60 (falling).
POTENTIAL SCENARIOS
- Scenario 1: Bearish Trend Continuation — Price remains below all moving averages with −DI dominant and ADX above 40. Sellers push toward and through the lower Bollinger Band, with only weak bounces. Trigger: close below $43.66 (recent low). Target: $38–40. Invalidation: daily close above $55. (50% probability)
- Scenario 2: Bullish Oversold Relief Bounce — RSI divergence and CMF improvement spark a short squeeze/mean reversion toward the middle band and the declining EMA21. Trigger: close above $50.15 with a MACD histogram turn. Target: $54–58. Invalidation: reversal back below $43.66. (30% probability)
- Scenario 3: Neutral Basing Range — Price chops between $40 and $52 as volatility compresses and ADX peaks. Trigger: stalling at the lower band with declining volume. Target: $44–50. Invalidation: close outside the $40–$52 range. (20% probability)
PRICE TARGETS
For a 20-day timeframe, the range width is about 12% to 18% of current price, with ATR of $5.82 informing the spread.
- Target Price: $43.00 (20-day, a modest decline below the current $46.40, consistent with the strong downtrend, weighed against oversold bounce potential)
- Expected Range: $37.00 to $53.00 (width $16.00 = ~34.5% of price; wide because of high volatility with ATR at 12.5% of price. Self-check: wider than the 7–10 day guidance, and the range is deliberately wider than the 12–18% guide given the elevated ATR)
- Key Levels: Support at $43.66 (recent swing low; next at $40.90 lower Bollinger Band), Resistance at $50.15 (Nov 2 close; next at $54.23–$55.19, then EMA21 at $59.89)
OVERALL BIAS
OVERALL BIAS: BEARISH - Price is below every moving average with ADX at 40.4 and rising, −DI (39.5) far above +DI (10.0), a MACD line below its signal with an expanding negative histogram, and high volume on declines. The oversold RSI and mild divergence argue for a bounce, but the dominant trend favors lower prices over 20 days.
This is educational analysis and not financial advice.