AAPL 20-day bearish forecast — Nov 8, 2026
- Bias: Bearish
- Timeframe: 20 days (made Nov 8, 2026, target date Nov 27, 2026)
- Price at analysis: $342.37
- Price target: $335.00
- Expected range: $322.00 – $356.00
- Result: Pending — graded after the close on Nov 27, 2026
Get a free AI analysis of AAPL today
Analysis
TECHNICAL INDICATORS
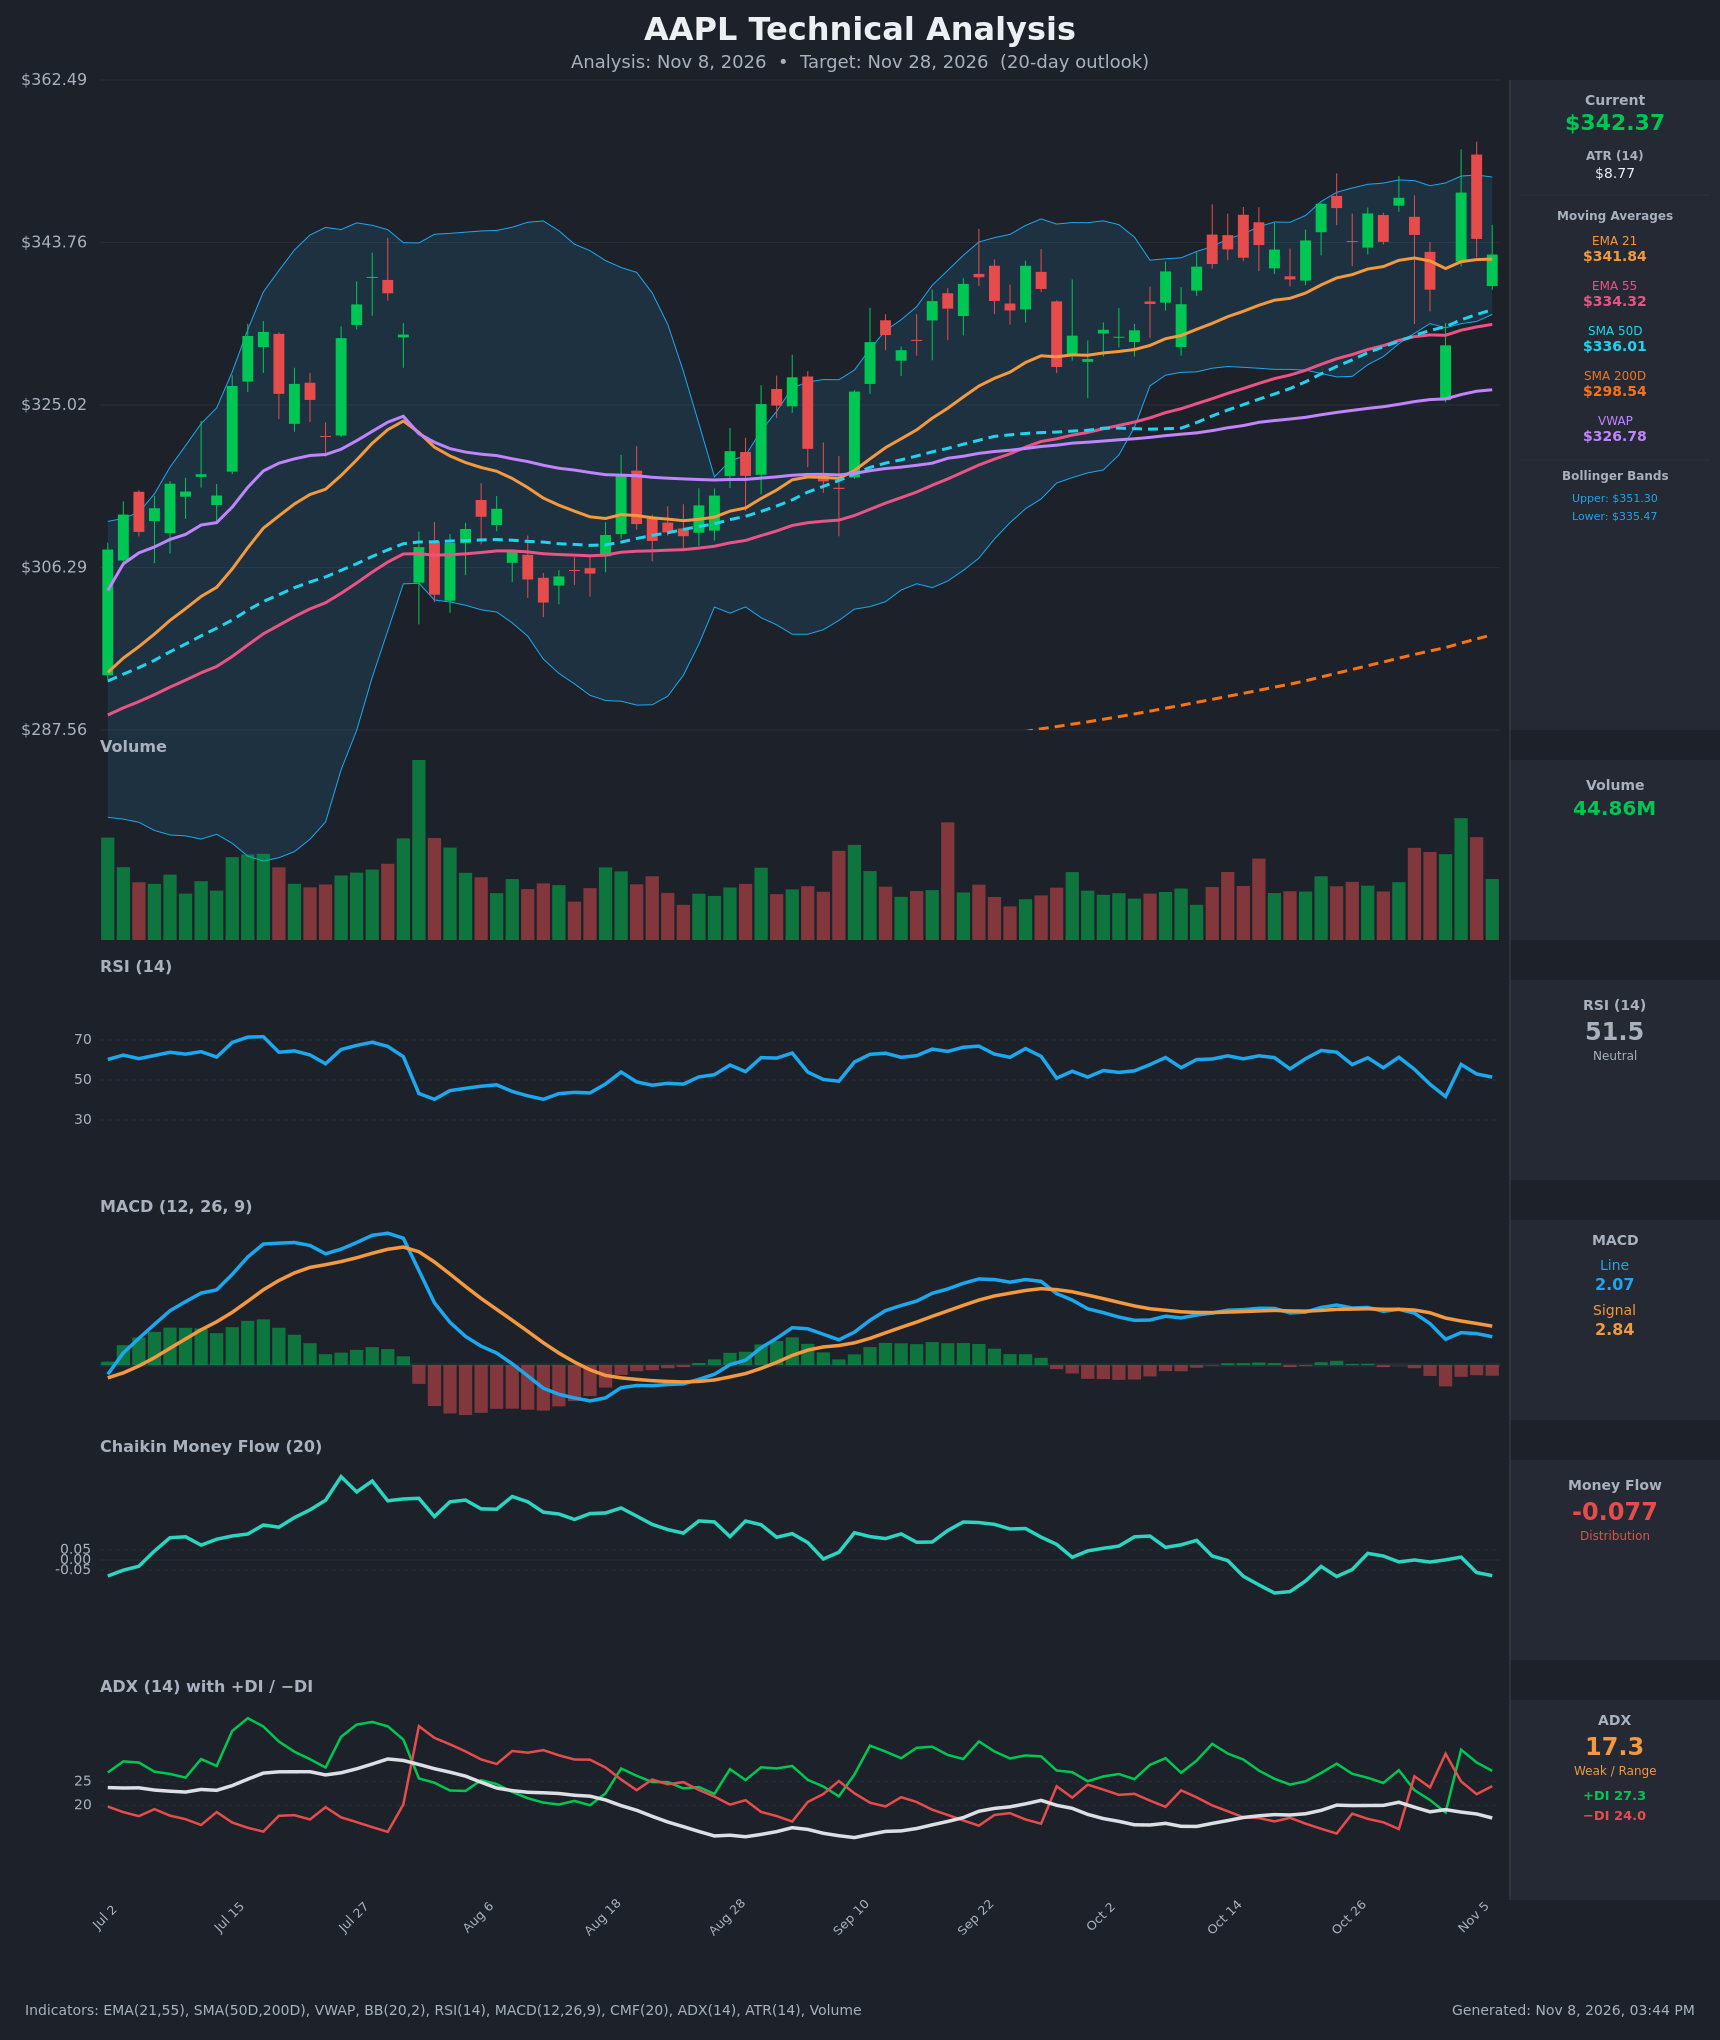
- RSI (14): 51.46, neutral and sitting on the midline. It has faded from 61-65 in late October. It dipped to 41.7 on Nov 3, then rebounded to the 50s, so momentum is flat to slightly weakening. [Neutral]
- 20 EMA (EMA 21 = $341.84): Price at $342.37 is only $0.53 above it. The EMA has flattened after rising through October, so it is acting as a pivot rather than firm support. EMA 21 remains above EMA 55 ($334.32) with no crossover. [Neutral]
- MACD: Line 2.07, signal 2.84, histogram negative (about -0.77). The line crossed below the signal around Oct 28-30 and the gap is still negative, although the Nov 4 bounce stopped the decline. The line has fallen from 4.4 to 2.1, showing fading momentum. [Bearish]
- Bollinger Bands (20): Upper $351.30, lower $335.47, midline about $343.4. Price is just below the midline, with a mid-range position of around 44%. The bands are fairly narrow compared with the summer, so volatility is compressing. Several failures near the upper band (about $349-350) show overhead supply. [Neutral]
- CMF (20): -0.077, below the -0.05 threshold. It has drifted from roughly +0.03 to -0.08 in the past week, and the chart shows it hovering near zero and slipping through the rally to $349. This points to mild distribution into strength. [Distribution]
- ADX (14): 17.3 and falling, so there is no strong trend and the market is range-bound. +DI 27.3 sits above -DI 24.0, a slight bullish edge after the -DI spike on Nov 3 (30.9) reversed. [Weak Trend, slight bullish lean]
- Volume: 44.86M, moderate. Heavy red bars appeared on the late-October/early-November selloff, followed by a large green bar on the Nov 4 rebound. This is no clear expansion in either direction. [Neutral / indecisive]
Longer-term structure remains constructive:
- Price is above SMA 200 ($298.54), SMA 50 ($336.01), VWAP ($326.78) and EMA 55.
- The golden cross is intact, with SMA 50 well above SMA 200.
DIVERGENCES & TRENDS
- Momentum divergence: Price printed a higher high at $349.51 on Nov 4, but RSI peaked at 57.8 versus 64.8 on Oct 22. MACD also peaked at 4.37 on Oct 23 and is now at 2.07. This is a mild bearish divergence.
- CMF divergence: CMF has not confirmed the push to new highs and has turned negative, which is a distribution signal.
- MACD: It crossed below its signal in late October and has not recovered. This is a bearish crossover within a still-positive MACD zone, suggesting a pullback rather than a trend reversal.
- ADX/DI: The ADX is below 20 and falling, so the market is not trending. A -DI over +DI crossover occurred on Oct 30 and Nov 3, and +DI regained the lead on Nov 4. The DI lines are whipsawing.
- Moving averages: The EMA 21/55 spread is stable at about $7.5. Price is compressing toward the EMA 21 and is $6-8 above the cluster of SMA 50 and EMA 55 ($334-336), the nearest support zone.
CHART PATTERNS
- Bearish Triple Top (reversal, loose fit): Highs at $348.22 (Oct 22), $347.73 (Oct 23), $347.10 (Oct 27), $348.91 (Oct 29) and $349.51 (Nov 4) form a flat resistance band at about $348-350. Support is the Nov 3 low area of about $331.90-$332. A close below $332 would confirm the pattern, with a measured target of roughly $315 (about $17 below the neckline).
- Alternative: Bullish Ascending Triangle / flag-type consolidation: The rising lows since August (EMA 21 trending up) against flat resistance at about $349 could resolve upward. A close above $350 would target about $360-$365. The weak ADX, negative CMF and negative MACD make this less likely right now.
- The pattern is incomplete, and the likeliest near-term move is a retest of the $334-$336 support cluster.
POTENTIAL SCENARIOS
- Scenario 1: Bearish Pullback to the MA Cluster — Rejection at the $349-350 resistance band, with negative MACD and CMF distribution pulling price back to the SMA 50/EMA 55 zone and possibly to the lower Bollinger band. Trigger: daily close below the EMA 21 ($341.84), then below $335. Target: $335, with an extension to $325-$332 if $332 breaks. Invalidation: daily close above $350. (45% probability)
- Scenario 2: Neutral Range Chop — Price oscillates between $332 and $349 with the ADX staying below 20. Trigger: holds above $335 and below $349. Target: $340-$345. Invalidation: close outside the $332-$350 range. (22% probability)
- Scenario 3: Bullish Breakout — +DI leads, MACD re-crosses upward and price clears the triple-top band on rising volume. Trigger: close above $350 with expanding volume. Target: $358-$362. Invalidation: close back below $344, or below the EMA 21 after the breakout. (33% probability)
PRICE TARGETS
- Target Price: $335.00 (20-day outlook, to Nov 28, 2026)
- Expected Range: $322.00 to $356.00. Width is $34, or about 9.9% of the current price, consistent with the 14-21 day guidance of 8-12%.
- Key Levels: Support at $334.32 (EMA 55, with SMA 50 at $336.01 and the lower Bollinger band at $335.47 nearby), Resistance at $349.51
OVERALL BIAS
OVERALL BIAS: BEARISH - Momentum is fading, with a MACD bearish crossover, negative CMF distribution, mild RSI/MACD divergence on the retest of the $349 highs, and a loose triple-top resistance band. The strong long-term uptrend should limit the downside to a pullback toward the $334-$336 MA support cluster rather than a full reversal.
This is educational analysis and not financial advice.