AMZN 20-day bullish forecast — Nov 8, 2026
- Bias: Bullish
- Timeframe: 20 days (made Nov 8, 2026, target date Nov 27, 2026)
- Price at analysis: $259.30
- Price target: $263.50
- Expected range: $247.00 – $273.00
- Result: Pending — graded after the close on Nov 27, 2026
Get a free AI analysis of AMZN today
Analysis
TECHNICAL INDICATORS
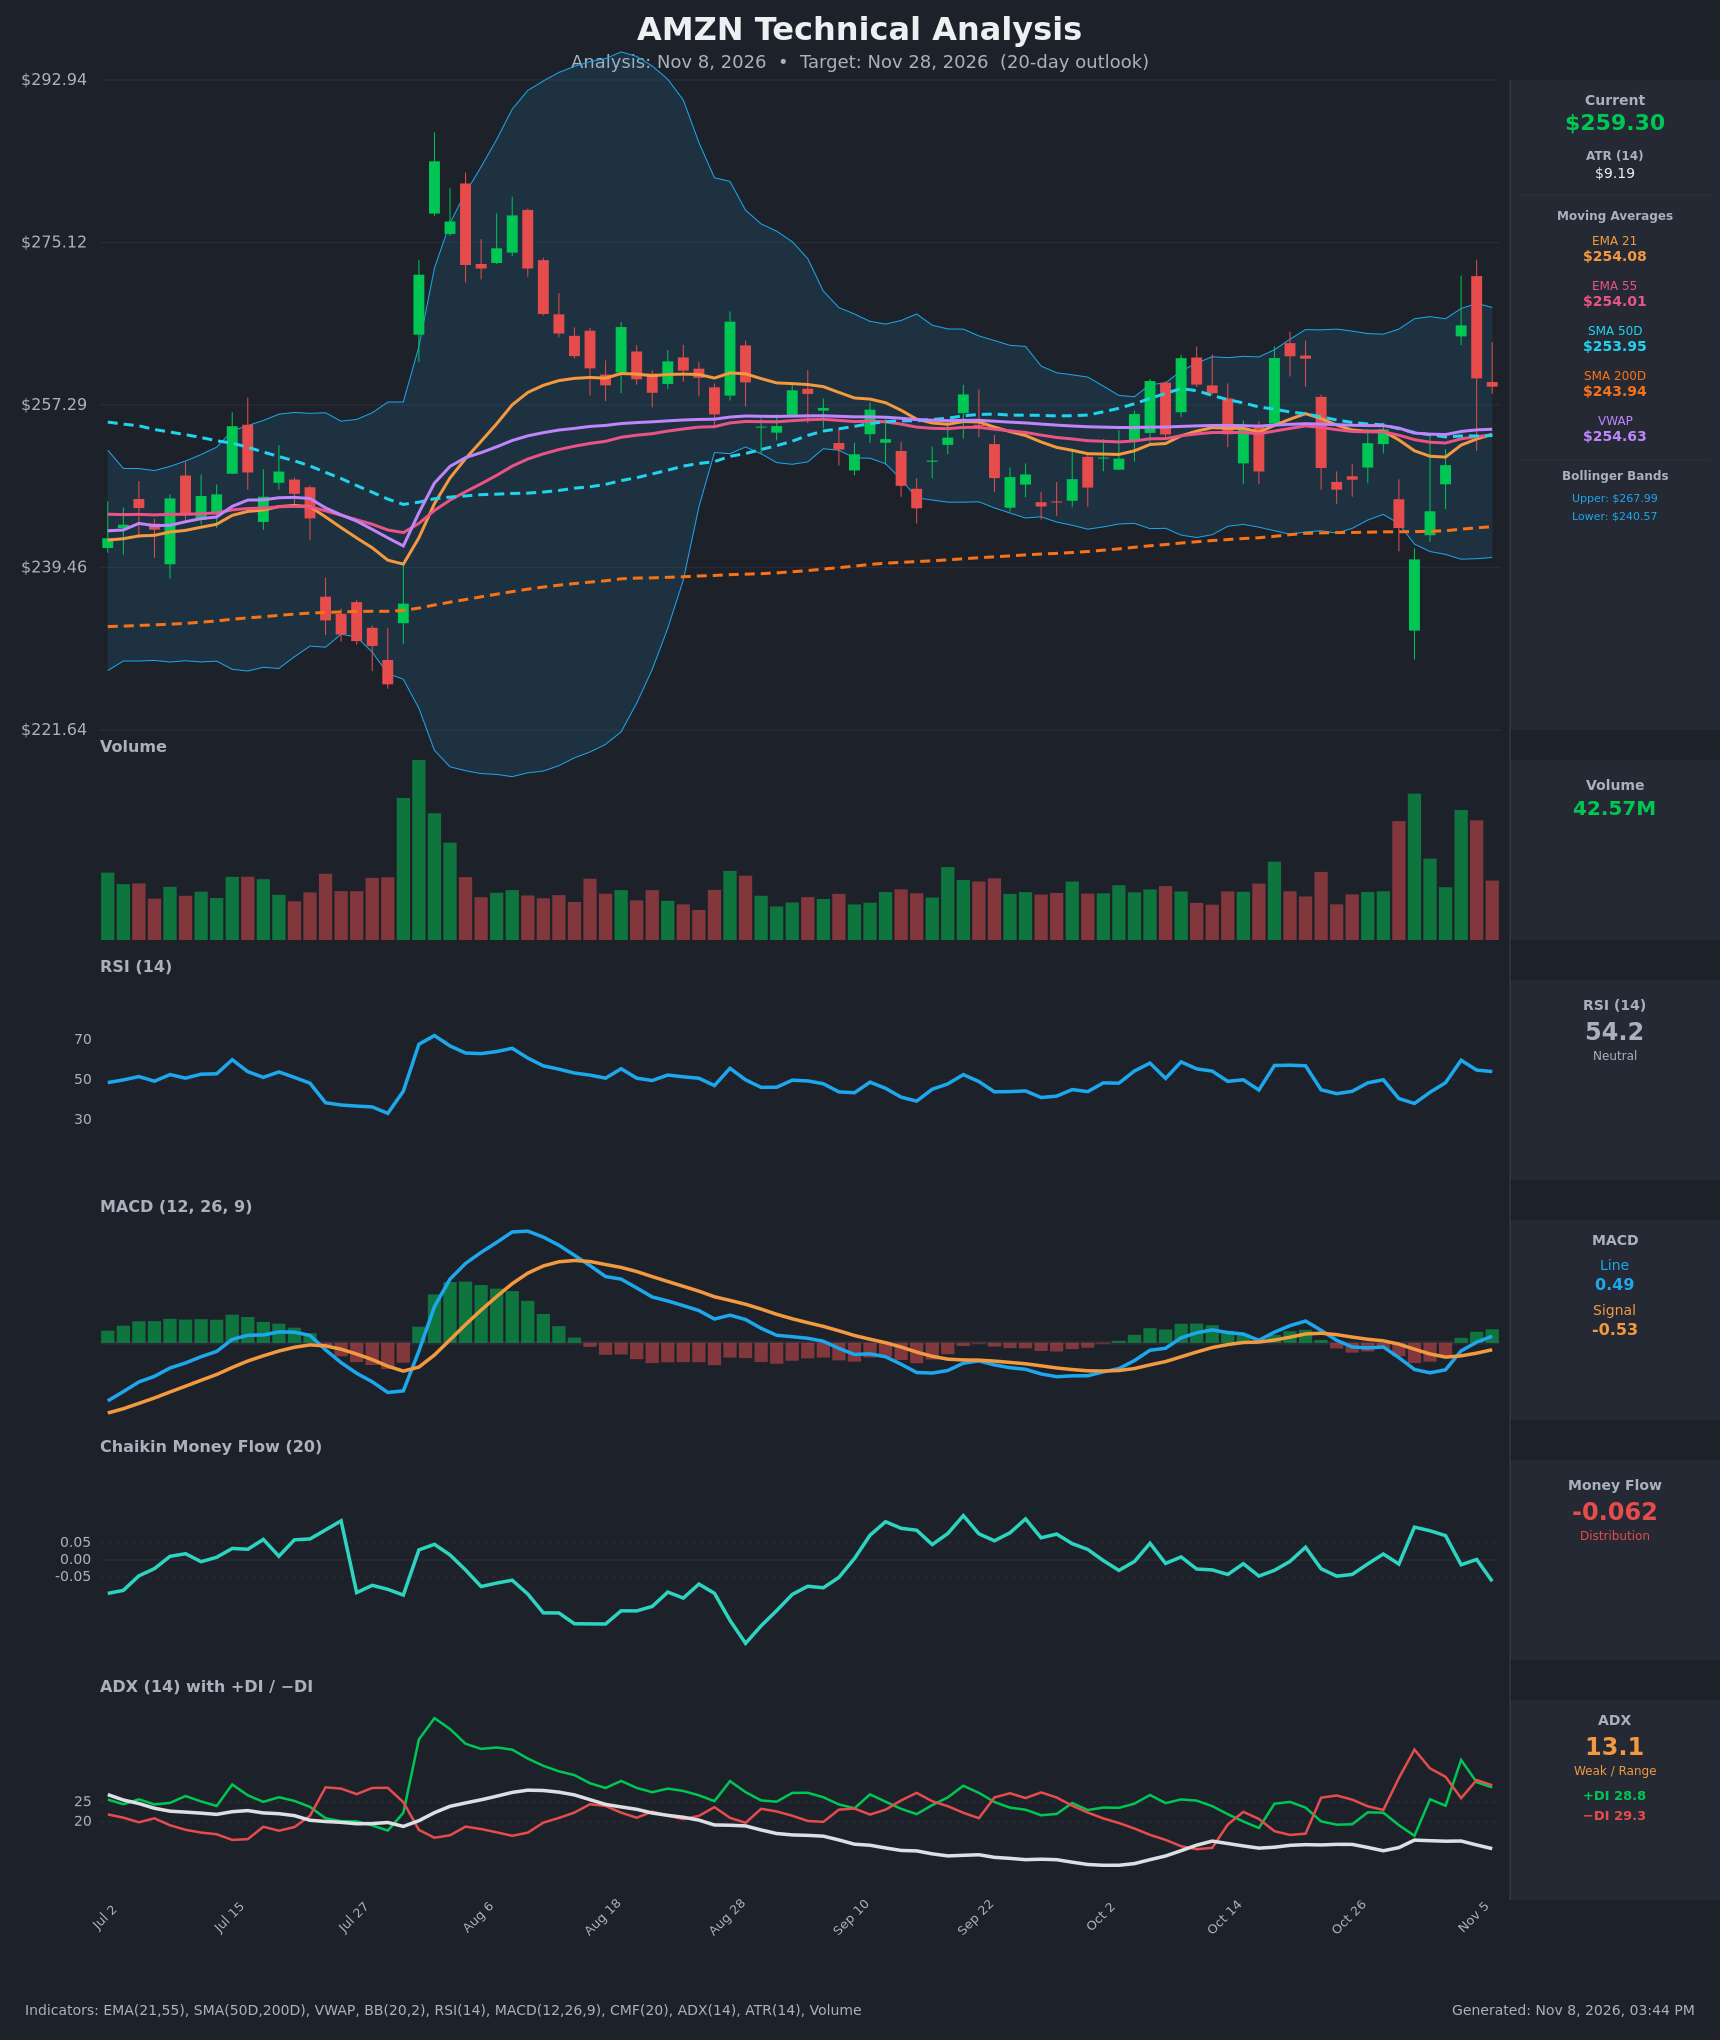
- RSI (14): 54.22, mid-range and neutral. It spiked to 59.9 on Nov 4 and has since eased to 55 and then 54, after rebounding from 38.3 on Oct 30. Momentum has recovered but is stalling short of 60. [Neutral]
- 20 EMA: The chart uses EMA 21 at $254.08. Price at $259.30 is about 2% above it, and the EMA has turned up from $251.58 on Nov 3. EMA21 sits just above EMA55 ($254.01) after crossing back up, so the cluster should act as support near $254. [Bullish]
- MACD: The line is at +0.49 and the signal at -0.53. The line crossed above the signal on Nov 5 and crossed zero, and the histogram has flipped positive and is expanding. This is a fresh bullish crossover from a low base. [Bullish]
- Bollinger Bands (20): The bands run from $240.57 to $267.99, with the midline near $254. Price is in the upper half, about 31% of band width below the upper band. The bands are moderately narrow compared with the summer expansion. The Nov 4 spike to roughly $266 was rejected near the upper band. [Neutral]
- CMF (20): -0.062, just below the -0.05 threshold. It has faded from +0.096 on Oct 30 to slightly negative as price rallied, so buying is not confirming the bounce. [Distribution]
- ADX (14): 13.1 with +DI 28.8 and −DI 29.3. ADX is well below 20 and falling, so there is no trend. The DIs are nearly equal and −DI is marginally on top, so neither side is in control. [Weak Trend / Range-bound]
- Volume: 42.57M. Volume was elevated on the Oct 22 and Oct 29 selloffs and the Nov 4 surge, then faded. The heavy-volume gap-up has not followed through, which suggests the move is being digested rather than driven by new buying. [Neutral]
DIVERGENCES & TRENDS
- Price vs CMF: Price is rising from $240 to $259 while CMF has slipped back into slightly negative territory. This is a mild bearish divergence in volume flow.
- Moving averages: EMA21, EMA55, SMA50D and VWAP have converged within about $0.70 of each other at roughly $254. This is a classic compression zone that precedes a directional move.
- Long-term trend: SMA50D ($253.95) is above SMA200D ($243.94), so the golden-cross structure is intact and the long-term uptrend holds. The SMA200D rose steadily and held the Oct 29-30 flush, as the long lower wick near $240 shows.
- MACD vs ADX: The MACD bullish cross comes with an ADX of 13, so its reliability is limited in chop.
- DI trend: +DI spiked to 35.8 on Nov 4 and has faded back to parity with −DI. Bulls have not secured control.
- Recent crossovers:
- EMA21 and EMA55 have just re-crossed upward.
- Price reclaimed all the MAs on Nov 4.
- MACD crossed bullish on Nov 5.
CHART PATTERNS
- Rectangle/range: Price has stayed between roughly $240 and $268 since early September. This resembles a loose range or triple-top-like structure at $265-268. The range top is capped by the Nov 4 spike and the Oct highs. The range floor is supported by the SMA200D and the $240 wick low.
- Bullish Double Bottom (loose): The Oct 30 low near $240 and the earlier lows around $241-243 form a rough double bottom with a neckline near $255-262. Price has pushed above the neckline, which suggests a measured move toward about $268-270, but the pattern is not clean.
- Resistance: The $266-268 area has capped rallies, so a break above it is the key trigger for a Bullish Double Bottom completion. The pattern is invalidated by a close back below $250.
POTENTIAL SCENARIOS
- Scenario 1: Bullish Range Breakout Attempt — Price holds the $254 moving-average cluster as support, and the fresh MACD cross and positive structure above the SMA200D carry price toward the top of the range. Trigger: a daily close above $262.50 with CMF turning positive. Target: $267-$270. Invalidation: a daily close below $253.90. (45% probability)
- Scenario 2: Neutral Range Chop — ADX stays below 20 and price oscillates between $250 and $266 around the converged MAs. Trigger: failure to close above $266 and failure to close below $252. Target: $255-$262. Invalidation: a close above $268 or below $248. (30% probability)
- Scenario 3: Bearish Rejection and Retest of Lows — Distribution (negative CMF) wins out and the $266 rejection leads to a break of the EMA/SMA cluster. Trigger: a daily close below $253.90 with −DI rising above 30. Target: $244-$246 (SMA200D), then $240. Invalidation: a close back above $262. (25% probability)
PRICE TARGETS
- Target Price: $263.50 (20-day horizon, modest upward bias)
- Expected Range: $247.00 to $273.00. Width is $26, or about 10.0% of the current price, which fits the 14-21 day guidance of 8-12%.
- Key Levels: Support at $254.00 (the EMA21/EMA55/SMA50D/VWAP cluster), Resistance at $268.00 (upper Bollinger Band and the Nov 4 spike high area)
OVERALL BIAS
OVERALL BIAS: BULLISH - Price is above every moving average and the SMA200D, the MACD has just crossed bullish, and the Oct 30 flush was bought at the SMA200D. The bias is modest because ADX is only 13.1 and CMF shows mild distribution, so the $266-268 range top is likely to cap gains.
This is educational analysis and not financial advice.