F 20-day bullish forecast — Nov 8, 2026
- Bias: Bullish
- Timeframe: 20 days (made Nov 8, 2026, target date Nov 27, 2026)
- Price at analysis: $12.44
- Price target: $12.80
- Expected range: $11.90 – $13.10
- Result: Pending — graded after the close on Nov 27, 2026
Get a free AI analysis of F today
Analysis
TECHNICAL INDICATORS
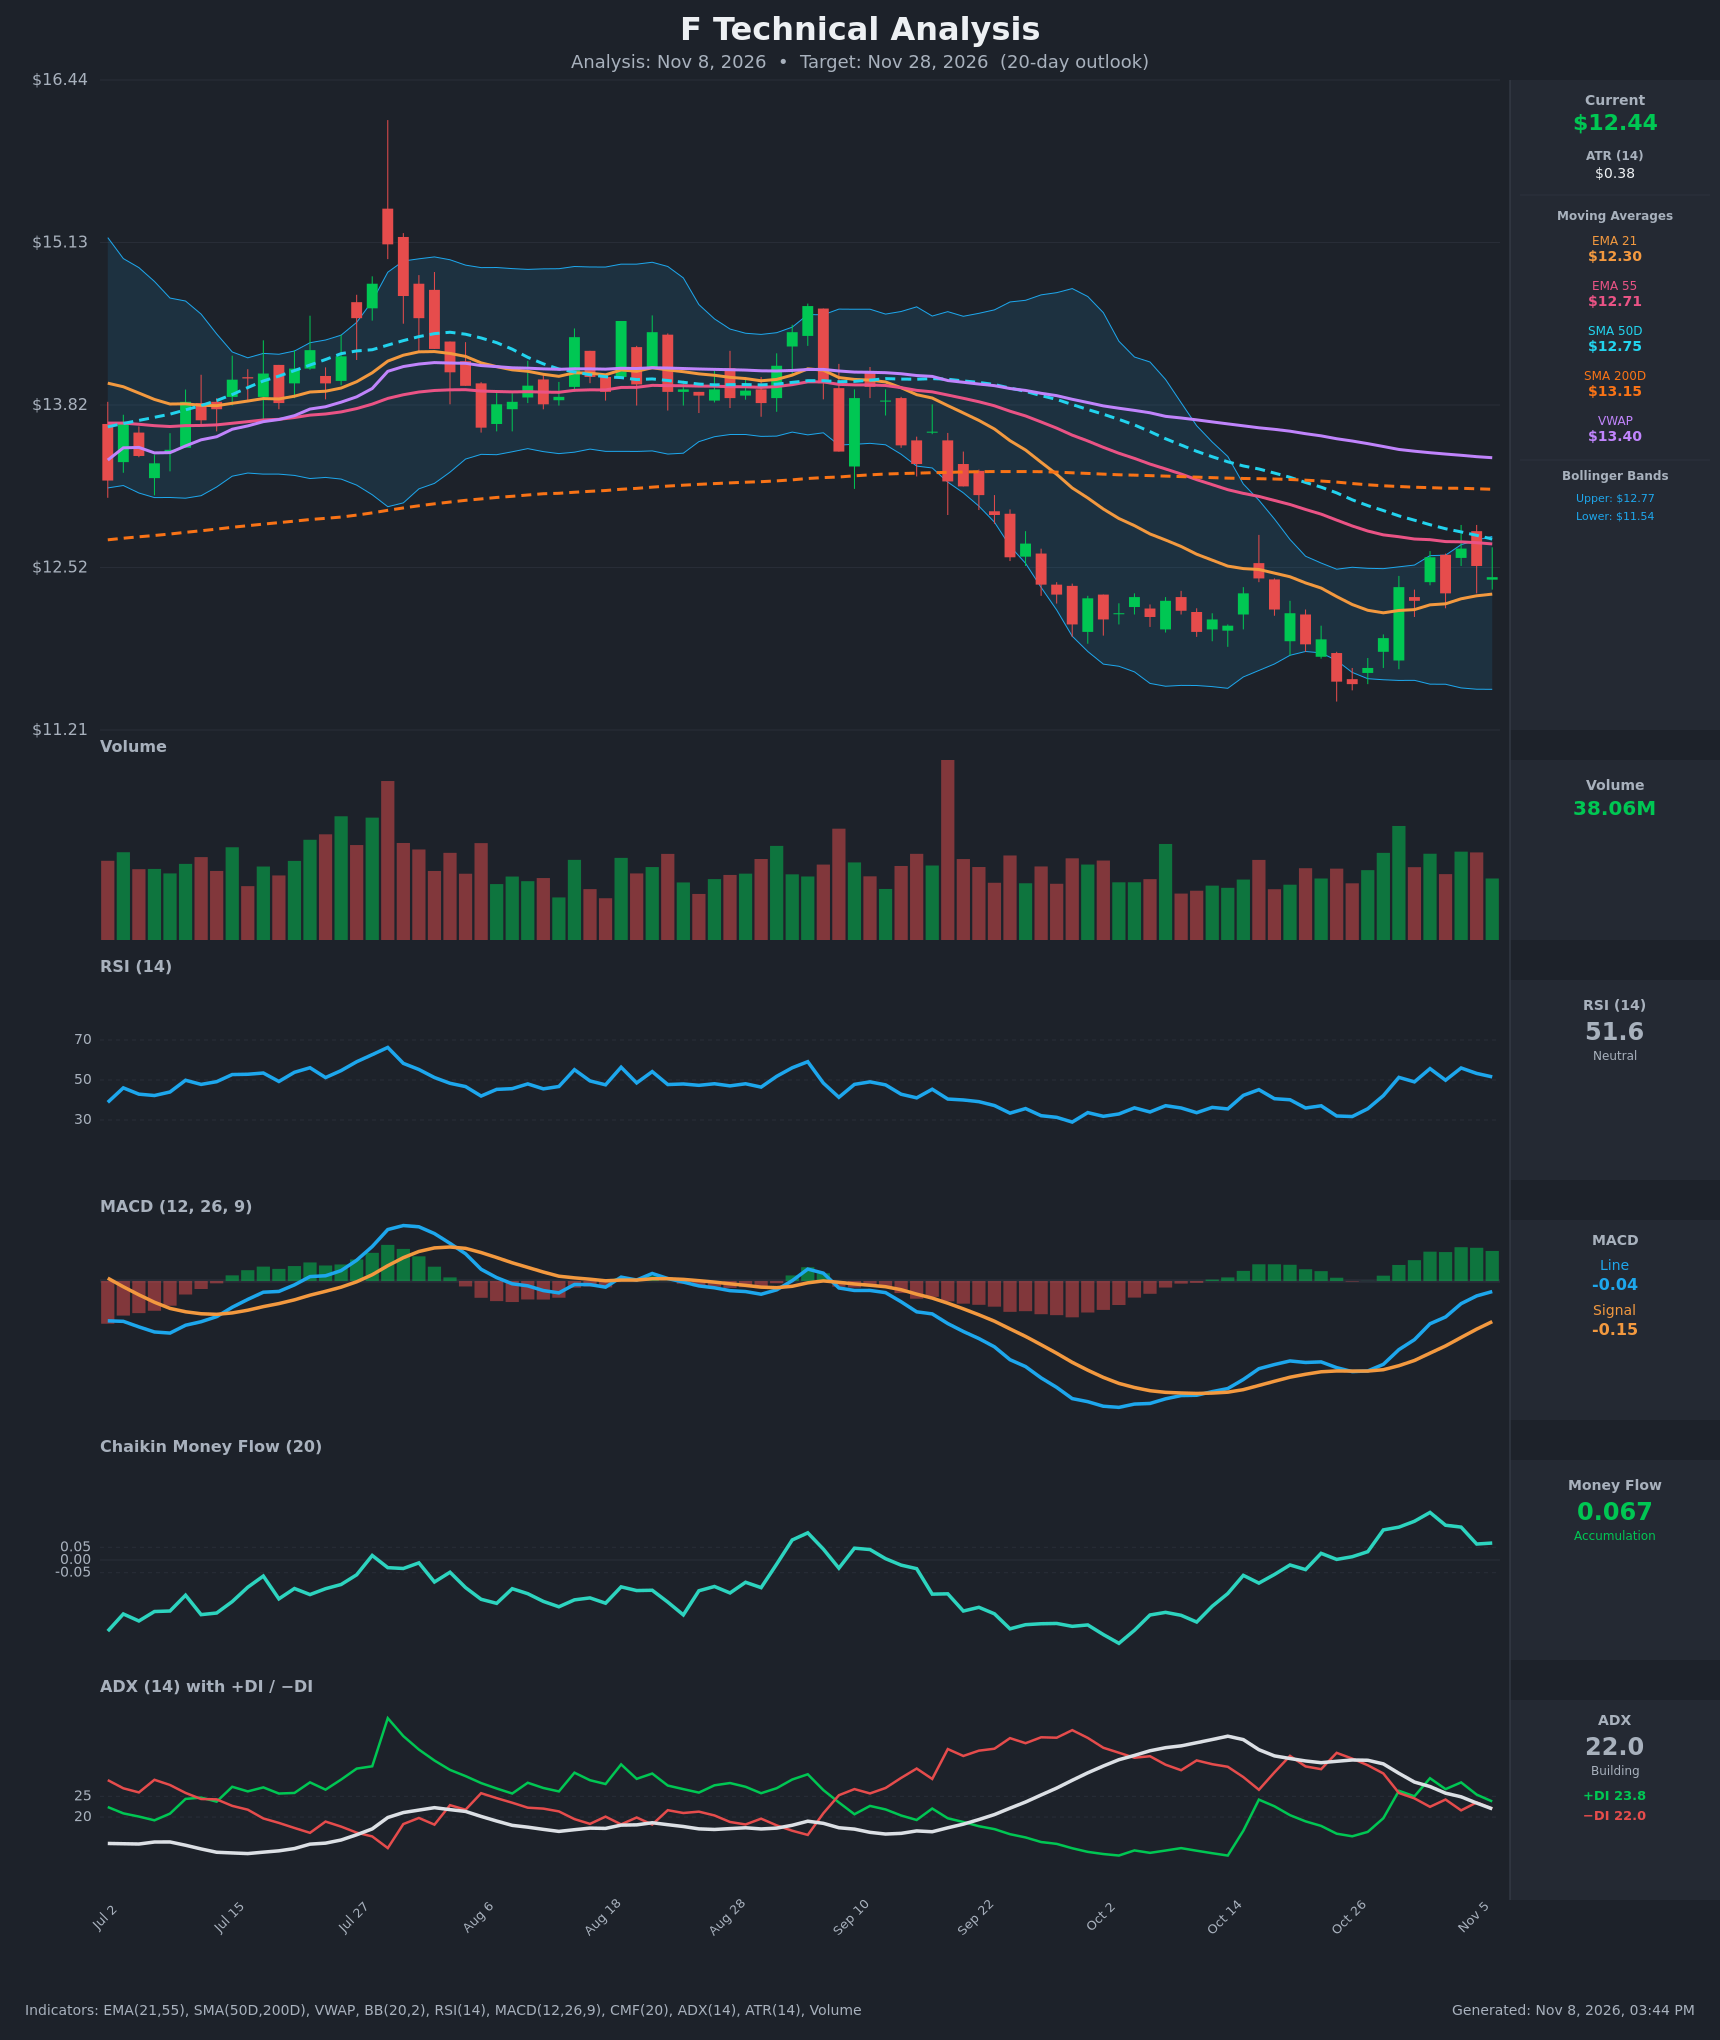
- RSI (14): 51.55, neutral. It has recovered from an oversold-adjacent 31.7 on Oct 26 and has stalled in the 50-56 zone over the last week. Momentum is no longer improving. [Neutral]
- 20 EMA (EMA 21): $12.30, with price at $12.44 above it. The EMA is now rising and acts as near-term support. Price is still below the EMA 55 ($12.71) and SMA 50 ($12.75), which stack as overhead resistance, and the SMA 200 ($13.15) and VWAP ($13.40) sit well above. [Bullish]
- MACD: Line -0.040, signal -0.154, histogram about +0.114. The bullish crossover happened around Oct 28-29. Both lines are rising toward zero, but the histogram peaked near +0.13 and is flattening. The line is still below zero, so this is a recovery rather than a confirmed uptrend. [Bullish]
- Bollinger Bands (20): Upper $12.77, lower $11.54, midline about $12.15. Price is in the upper half of the bands after the squeeze/expansion decline and sits just below the upper band, which coincides with the EMA 55/SMA 50 cluster. Room to run is limited without a push through $12.77. [Neutral]
- CMF (20): +0.067, above the +0.05 threshold. It has been positive since late October and peaked near 0.19 on Nov 2. It is fading but still shows mild accumulation. [Accumulation]
- ADX (14): 22.0, down from 34.8 as the prior downtrend loses strength. +DI is 23.8 vs −DI 22.0, so bulls are marginally on top after the late-October crossover. The spread is very thin, which means a weak, undecided trend. [Weak Trend, slight bullish lean]
- Volume: 38.06M, in line with recent averages. The rebound candles in late October carried above-average volume, but volume has not expanded on the move toward $12.60. This is moderate confirmation, not a strong breakout signal. [Neutral to mildly Bullish]
DIVERGENCES & TRENDS
- Positive divergence (resolved): Price made a low at about $11.58 on Oct 26 while MACD and RSI had already stopped making new lows. That supported the recovery.
- MACD crossover: The bullish cross in late October is intact, and the line is closing in on the zero line.
- DI crossover: +DI crossed above −DI around Oct 29. ADX is falling, so this is a trend-exhaustion signal on the downside rather than a new uptrend.
- EMA/SMA structure: EMA 21 is rising toward EMA 55, but a bullish cross has not occurred yet. SMA 50 is below SMA 200 (death cross already in place), so the long-term trend is still down.
- Momentum fade: RSI and CMF have topped near-term (RSI is below its Nov 4 reading of 56, and CMF is below its Nov 2 peak). The rally is losing some steam into resistance.
- Price vs VWAP/SMA 200: Price is below both, which shows overhead supply.
CHART PATTERNS
- Bullish Double Bottom / Falling Wedge (reversal): The decline from $13.8 to $11.58 followed by a higher low and sharp rebound resembles a bullish double bottom. The declining-channel structure resembles a bullish falling wedge. A confirmed breakout needs a close above about $12.77 (BB upper/SMA 50/EMA 55 cluster). The measured move points toward $13.1-$13.2 (SMA 200 area).
- Caveat: Price is still below the SMA 50, EMA 55, SMA 200 and VWAP, so this is a countertrend recovery. A rejection at $12.75 would turn the structure into a lower-high range within the larger downtrend, similar to a Bearish Rising Wedge/bear flag in a bounce.
POTENTIAL SCENARIOS
- Scenario 1: Bullish Breakout Above the MA Cluster — Price clears the EMA 55/SMA 50/BB upper cluster as MACD pushes through zero and CMF stays positive, completing the double-bottom/falling-wedge reversal. Trigger: daily close above $12.78 on above-average volume. Target: $13.10-$13.15 (SMA 200). Invalidation: close below $12.30 (EMA 21). (45% probability)
- Scenario 2: Bearish Rejection at Resistance — Price fails at the $12.70-$12.77 resistance cluster, RSI rolls below 50, and the MACD histogram turns negative, resuming the downtrend. Trigger: rejection at $12.75 and a close below $12.30. Target: $11.90 then $11.58 (October low). Invalidation: close above $12.80. (35% probability)
- Scenario 3: Neutral Range Chop — Price oscillates between the EMA 21 support and the $12.77 resistance while ADX stays near or below 22. Trigger: ADX below 20 and no close beyond $12.30 or $12.77. Target: $12.30-$12.75. Invalidation: decisive close outside that range. (20% probability)
PRICE TARGETS
- Target Price: $12.80 (20-day, Nov 28, 2026). Slightly bullish on the MACD/DI crossovers, the CMF accumulation and the higher-low structure.
- Expected Range: $11.90 to $13.10 (width $1.20, about 9.6% of the current price, consistent with the 14-21 day guidance and about 1.5x the 2 ATR-weighted swing expected over this horizon)
- Key Levels: Support at $12.30 (EMA 21), with deeper support at $11.58. Resistance at $12.75 (SMA 50/EMA 55), with the next resistance at $13.15 (SMA 200).
OVERALL BIAS
OVERALL BIAS: BULLISH - Price has reclaimed the EMA 21, MACD has crossed bullishly, +DI is slightly above −DI, and CMF shows accumulation. The conviction is modest because price must still clear the heavy $12.71-$12.77 resistance cluster and remains below the SMA 200 and VWAP.
This is educational analysis and not financial advice.