DELL 20-day bearish forecast — Nov 8, 2026
- Bias: Bearish
- Timeframe: 20 days (made Nov 8, 2026, target date Nov 27, 2026)
- Price at analysis: $328.53
- Price target: $316.00
- Expected range: $296.00 – $336.00
- Result: Pending — graded after the close on Nov 27, 2026
Get a free AI analysis of DELL today
Analysis
TECHNICAL INDICATORS
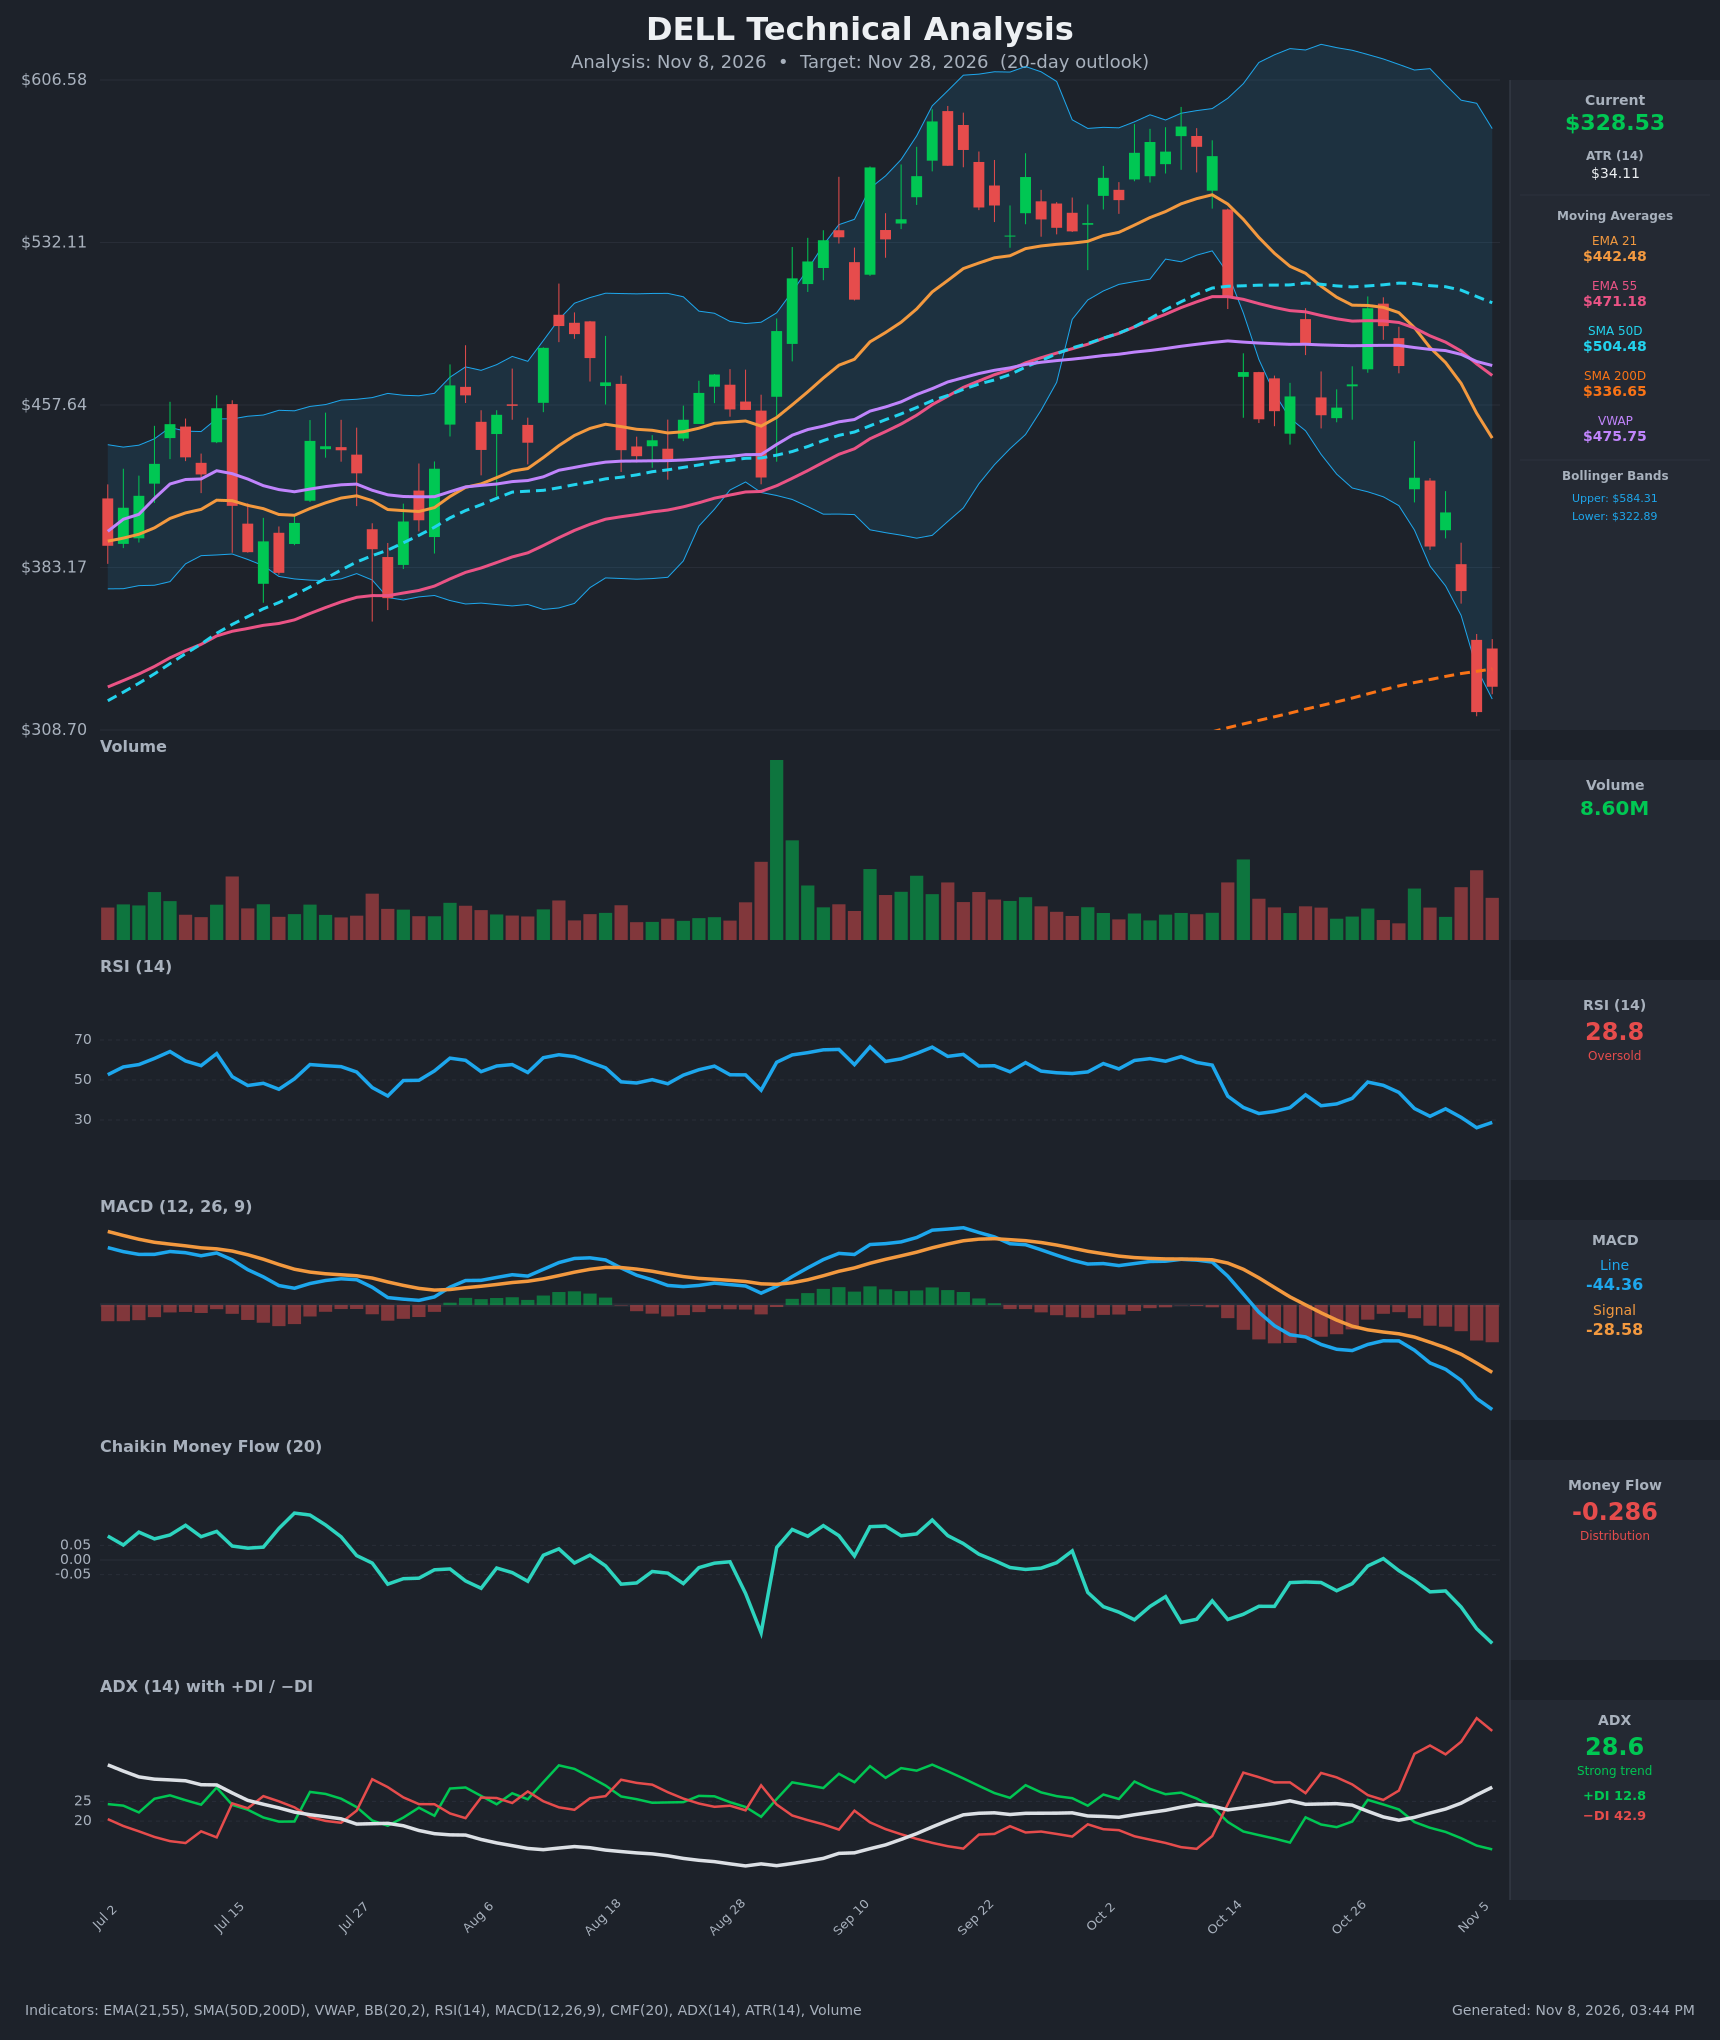
- RSI (14): 28.79, in oversold territory and down from 49 on Oct 27. It made a low of 26.1 on Nov 5 and ticked up only slightly. There is no bullish divergence yet, since RSI and price are both making new lows. [Bearish]
- 20 EMA (EMA 21): $442.48, about 35% above price and falling steeply. EMA 21 crossed below EMA 55 ($471.18) on Oct 30, a bearish crossover. The EMAs are acting as heavy overhead resistance. [Bearish]
- MACD: Line -44.36, signal -28.58, with the histogram widening negative (about -15.8). The line has been below the signal since Oct 19, and the gap is still expanding. This is accelerating downside momentum. [Bearish]
- Bollinger Bands (20): Upper $584.31, lower $322.89. Price at $328.53 is hugging the lower band after closing below it at $316.91 on Nov 5. The bands are very wide after the volatile run, so this is a stretched condition. A bounce is possible, but in strong trends price can "walk the band". [Neutral]
- CMF (20): -0.286, well below -0.05 and falling for several weeks (from about 0 on Oct 28). This is heavy, persistent distribution. [Distribution]
- ADX (14): 28.6 and rising, above 25, so the trend is strong. -DI at 42.9 is far above +DI at 12.8, so bears are firmly in control. -DI has been on top since Oct 30 and the spread is wide. [Strong Trend – Bearish]
- Volume: 8.60M, elevated versus the typical base, with the heaviest bars on the red candles of the recent decline. This is selling pressure, though it could also mark partial capitulation. The Nov 6 bounce came on lighter volume than the breakdown day. [Bearish with capitulation risk]
Other levels:
- VWAP: $475.75, so price is far below it, which is bearish.
- SMA 50D: $504.48. It is still above the SMA 200D, so there is no death cross yet, but it is rolling over.
- SMA 200D: $336.65, rising. Price is just below it, so the long-term support line has been lost on a closing basis, and it now acts as first resistance.
DIVERGENCES & TRENDS
- There is no bullish RSI or MACD divergence. Both made new lows with price (RSI 26.1 on Nov 5, MACD -44.4 on Nov 6), which confirms the downtrend rather than warning of exhaustion.
- RSI fell from 49 to under 30 in about 8 sessions. This is a rapid momentum collapse, and the oversold reading favors a bounce but does not give a reversal signal.
- MACD and CMF are both accelerating downward, and ADX is rising with -DI dominant. Trend indicators are aligned bearishly.
- Price is trading below the EMA 21, EMA 55, SMA 50D, VWAP and now the SMA 200D, which is a full bearish moving average stack.
- The EMA 21 / EMA 55 bearish cross on Oct 30 has been confirmed by the continued slide. The SMA 50D is flattening and rolling over, so a longer-term death cross is possible later.
- Price is pressing against the SMA 200D ($336.65) and the lower Bollinger Band ($322.89) at the same time. This is a decision zone: a reclaim of the SMA 200D means a relief bounce, while a failure means a break lower.
CHART PATTERNS
- Bearish Double Top (reversal): Price peaked near $585–590 in September and again in early October, around $580. The neckline near $450–457 broke in mid/late October. The measured move (about $135 height) projects to about $320, which price has essentially reached.
- Failed rebound / bearish continuation: The brief bounce to about $500 on Oct 27 was rejected at the EMA/SMA cluster and sold off hard. This is typical of a lower-high continuation in a breakdown.
- The double-top target is mostly achieved, so incremental downside is likely limited, and relief rallies (to the SMA 200D at $336.65 and the $350–$360 area) are plausible within the downtrend. Further downside would need a close below the Nov 5 low.
POTENTIAL SCENARIOS
- Scenario 1: Bearish Trend Continuation / Base Failure — Price fails to reclaim the SMA 200D at $336.65, and the strong −DI and negative MACD and CMF keep pressure on. Sellers push price back toward the Nov 5 low and probe lower. Trigger: rejection at $336–$345 or a close below $316.91. Target: $305–$316 initially, with extension to about $296. Invalidation: daily close above $350 on rising volume. (45% probability)
- Scenario 2: Bullish Oversold Relief Bounce — RSI below 30, price at the lower Bollinger Band and the double-top measured move reached together set up a snap-back. Price reclaims the SMA 200D and rallies toward the first resistance zone. Trigger: close above $336.65 and RSI above 35 with MACD histogram shrinking. Target: $360–$375 (about 1–1.5 ATR-multiple rebound; EMA 21 at $442 is too far for 20 days). Invalidation: close below $316.91. (35% probability)
- Scenario 3: Neutral Choppy Base — Price oscillates between about $310 and $345 as selling exhausts and buyers defend the SMA 200D area. Trigger: low-volume consolidation with RSI hovering 30–40. Target: about $325–$335. Invalidation: close outside $308–$350. (20% probability)
PRICE TARGETS
- Target Price: $316.00 (20-day target, a modest drift lower from $328.53 as trend indicators outweigh the oversold bounce potential)
- Expected Range: $296.00 to $336.00 (width $40, about 12.2% of current price, consistent with the 14–21 day guidance)
- Key Levels: Support at $308.70, Resistance at $336.65
OVERALL BIAS
OVERALL BIAS: BEARISH - Price is below every major moving average and VWAP, MACD, CMF and −DI are all deteriorating with ADX rising, and no bullish divergence has formed. The oversold RSI and the nearly completed double-top target raise the risk of a relief bounce, so conviction is moderate, with downside likely limited to the low $300s and the $336.65 SMA 200D as the key hurdle.
This is educational analysis and not financial advice.