HOOD 20-day bearish forecast — Nov 8, 2026
- Bias: Bearish
- Timeframe: 20 days (made Nov 8, 2026, target date Nov 27, 2026)
- Price at analysis: $80.91
- Price target: $77.50
- Expected range: $68.50 – $90.00
- Result: Pending — graded after the close on Nov 27, 2026
Get a free AI analysis of HOOD today
Analysis
TECHNICAL INDICATORS
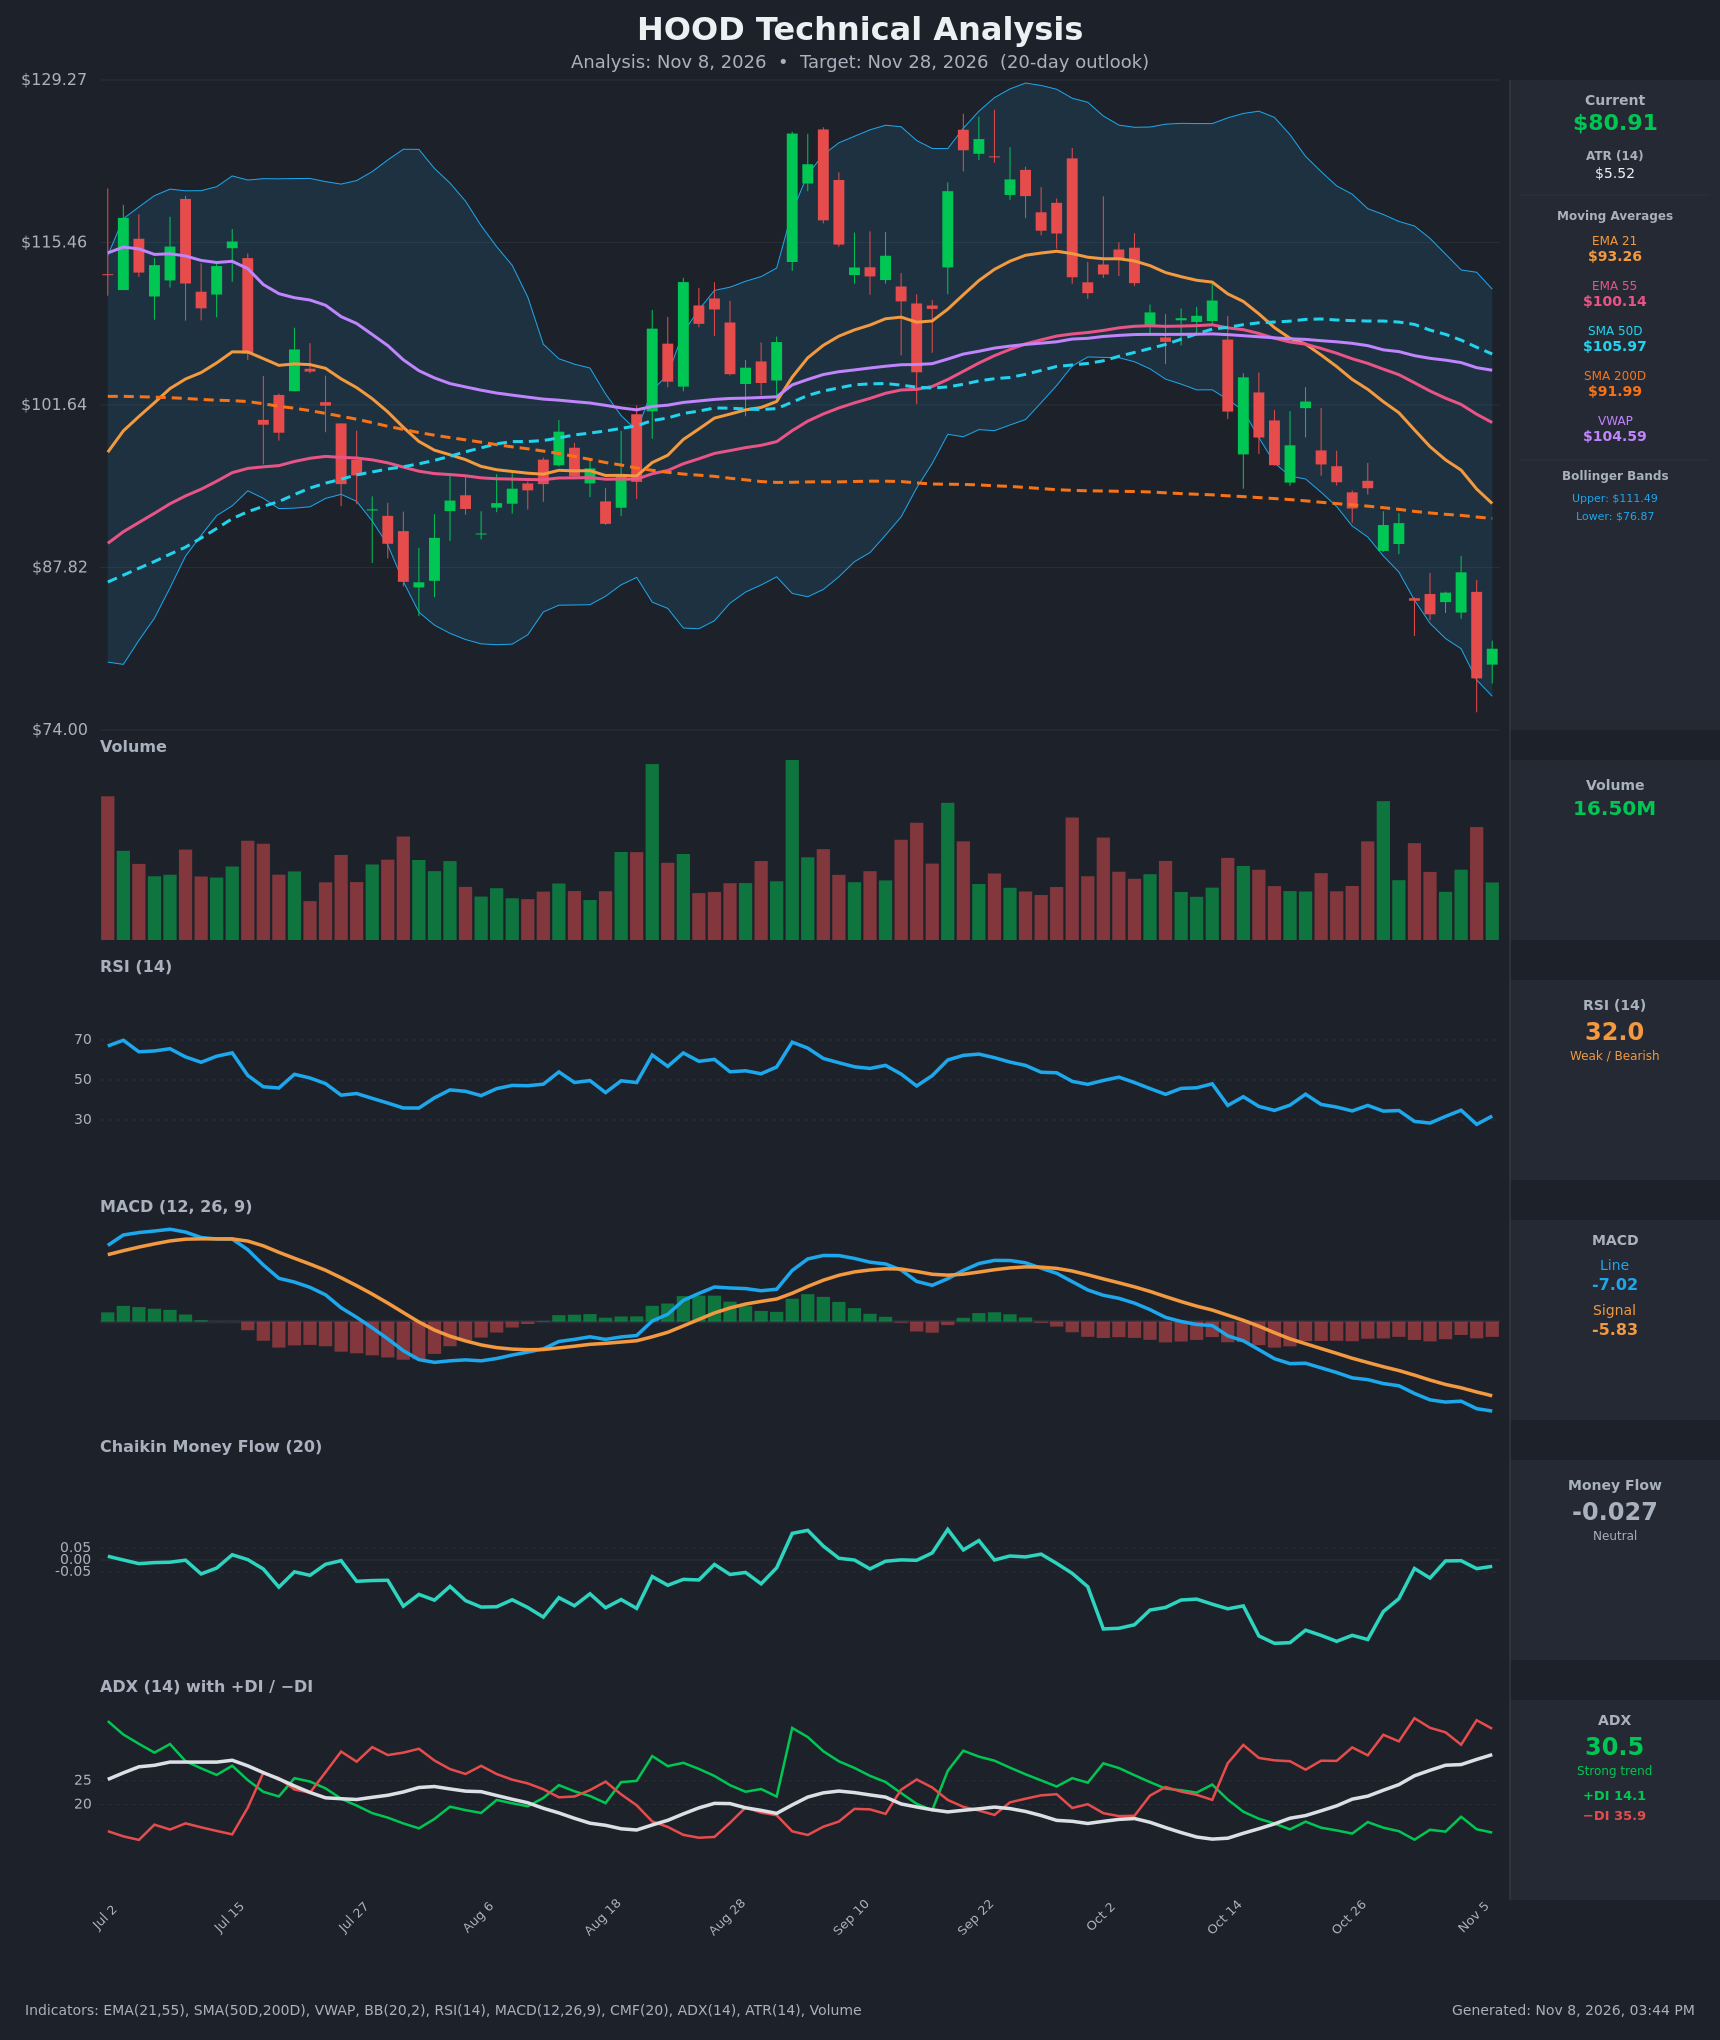
- RSI (14): 31.97, just above the oversold line at 30. It has made lower lows (34.8 → 27.8 → 32.0) and is still in a downtrend. The Nov 5 reading of 27.8 was oversold, and the bounce to 32 is only modest. [Bearish]
- 20 EMA (EMA 21): $93.26, well above the $80.91 price (about 13% overhead) and falling steeply. It is below EMA 55 ($100.14) and was crossing down through it in late October. It acts as resistance. [Bearish]
- MACD: Line -7.02 is below signal -5.83, and the gap is widening (-2.9 vs -0.9 on Oct 19 → -7.0 vs -5.8). The histogram is negative and still expanding, so downside momentum has not turned. [Bearish]
- Bollinger Bands (20): Upper $111.49, lower $76.87, midline about $94. Price at $80.91 is in the lower quarter of the bands, after probing below the lower band on Nov 5 (close $78.39). The bands are wide after the selloff. Riding the lower band is a trend-continuation signal, though a mean-reversion bounce toward $90–94 is possible. [Bearish]
- CMF (20): -0.027, in the neutral zone (±0.05). It has improved sharply from -0.35 in mid-October, so selling pressure has eased even as price kept falling. This is a mild bullish divergence, but it is not accumulation. [Neutral]
- ADX (14): 30.5 and rising (16 → 30.5 in 15 sessions), a strong trend. −DI at 35.9 is far above +DI at 14.1, so bears are firmly in control. [Strong Trend – Bearish]
- Volume: 16.50M on the latest bar, with no sign of capitulation volume. Red-bar volume was heavier during the Nov 5 breakdown, and the small green bounce has modest volume. The sell-off lacks a climactic washout. [Neutral to Mildly Bearish]
DIVERGENCES & TRENDS
- Moving averages: Price ($80.91) is below EMA21, EMA55, SMA50D ($105.97), SMA200D ($91.99) and VWAP ($104.59). EMA21 is now below EMA55. SMA50D is still above SMA200D, but the gap is shrinking (SMA50D falling, 108.7 → 106.0). A death cross is a potential 1–2 month risk.
- Price falling below the SMA200D is a significant break of long-term support, which now becomes resistance near $92.
- CMF divergence: CMF has risen from -0.35 to -0.03 while price made new lows. This hints at fading distribution but does not confirm a reversal.
- RSI: Pinned in the 28–37 range for two weeks without a bullish divergence. RSI is oversold-adjacent, so a relief bounce is likely, but the readings are not yet reversal-grade.
- MACD: The bearish crossover occurred in early October. The histogram keeps growing, so there is no momentum turn yet.
- ADX/DI: −DI has been above +DI throughout the decline. The trend is strengthening rather than exhausting.
- Price action: Lower highs and lower lows from the $125 peak in mid-September. A big bearish engulfing candle on Nov 5 broke below the lower Bollinger Band, followed by a small bounce.
CHART PATTERNS
- Descending channel / bearish continuation: A sequence of lower highs and lower lows resembling a Bearish Flag/Pennant continuation after the sharp early-October break. Nov 5 opened a new leg down. The prior leg from $101 (Oct 21) to $80 is a roughly $21 move.
- Failed head-and-shoulders resemblance (Aug–Oct): The September $125 peak with lower shoulders around $115 is a mildly bearish reversal structure whose neckline (about $101–105) broke in October. Measured move targets the $80s, which is now being reached.
- Support: The first support zone is the lower Bollinger Band ($76.87) and the $74 chart low. If broken, it exposes lower prices.
- A Bullish Falling Wedge is a possibility only if price starts to contract and stabilize, but there is no confirmation yet.
POTENTIAL SCENARIOS
- Scenario 1: Bearish Trend Continuation — Strong ADX with −DI dominant, MACD expanding negatively, and price below all MAs. Sellers push price through the lower band and the $74–77 area. Trigger: Daily close below $77 (lower band / Nov 5 low zone around $78). Target: $70–74. Invalidation: Daily close above $93 (EMA21). (45% probability)
- Scenario 2: Bearish-Leaning Relief Bounce, Then Fade — RSI near oversold and CMF improving trigger a bounce toward the EMA21 and SMA200D region ($88–93). Sellers defend the declining EMA and the price ranges lower into the end of the window, ending a bit under the current level or near it. Trigger: Hold above $78 and reclaim $85. Target: $88–92 interim, then fade to about $78–82. Invalidation: Close above $95 with expanding volume. (30% probability)
- Scenario 3: Bullish Oversold Reversal — Capitulation washout, then a sustained rebound as CMF turns positive and RSI breaks above 40. Price reclaims the SMA200D. Trigger: Close above $88 on rising volume. Target: $95–98. Invalidation: Close below $76. (25% probability)
PRICE TARGETS
- Target Price: $77.50 (20-day horizon, Nov 28, 2026)
- Expected Range: $68.50 to $90.00 (width $21.50 ≈ 26.6% of current price — within the 18–30% guide for 20 days at elevated ATR; wider than any 2–3 day range)
- Key Levels: Support at $76.87 (lower Bollinger Band), Resistance at $93.26 (EMA21)
Self-check: ATR of $5.52 implies roughly a $12 one-sigma range over 20 days (about 4.5 × ATR ≈ $25), so the range width is consistent with volatility. Target is below current price, consistent with a bearish bias.
OVERALL BIAS
OVERALL BIAS: BEARISH - Price sits below every major moving average, MACD is below its signal with an expanding negative histogram, and ADX at 30.5 with −DI (35.9) far above +DI (14.1) confirms a strong downtrend. Near-term oversold conditions and improving CMF raise the odds of a bounce, but the bounce likely meets resistance at the falling EMA21 and SMA200D.
This is educational analysis and not financial advice.