IBM 20-day bearish forecast — Nov 8, 2026
- Bias: Bearish
- Timeframe: 20 days (made Nov 8, 2026, target date Nov 27, 2026)
- Price at analysis: $245.00
- Price target: $238.50
- Expected range: $226.00 – $252.00
- Result: Pending — graded after the close on Nov 27, 2026
Get a free AI analysis of IBM today
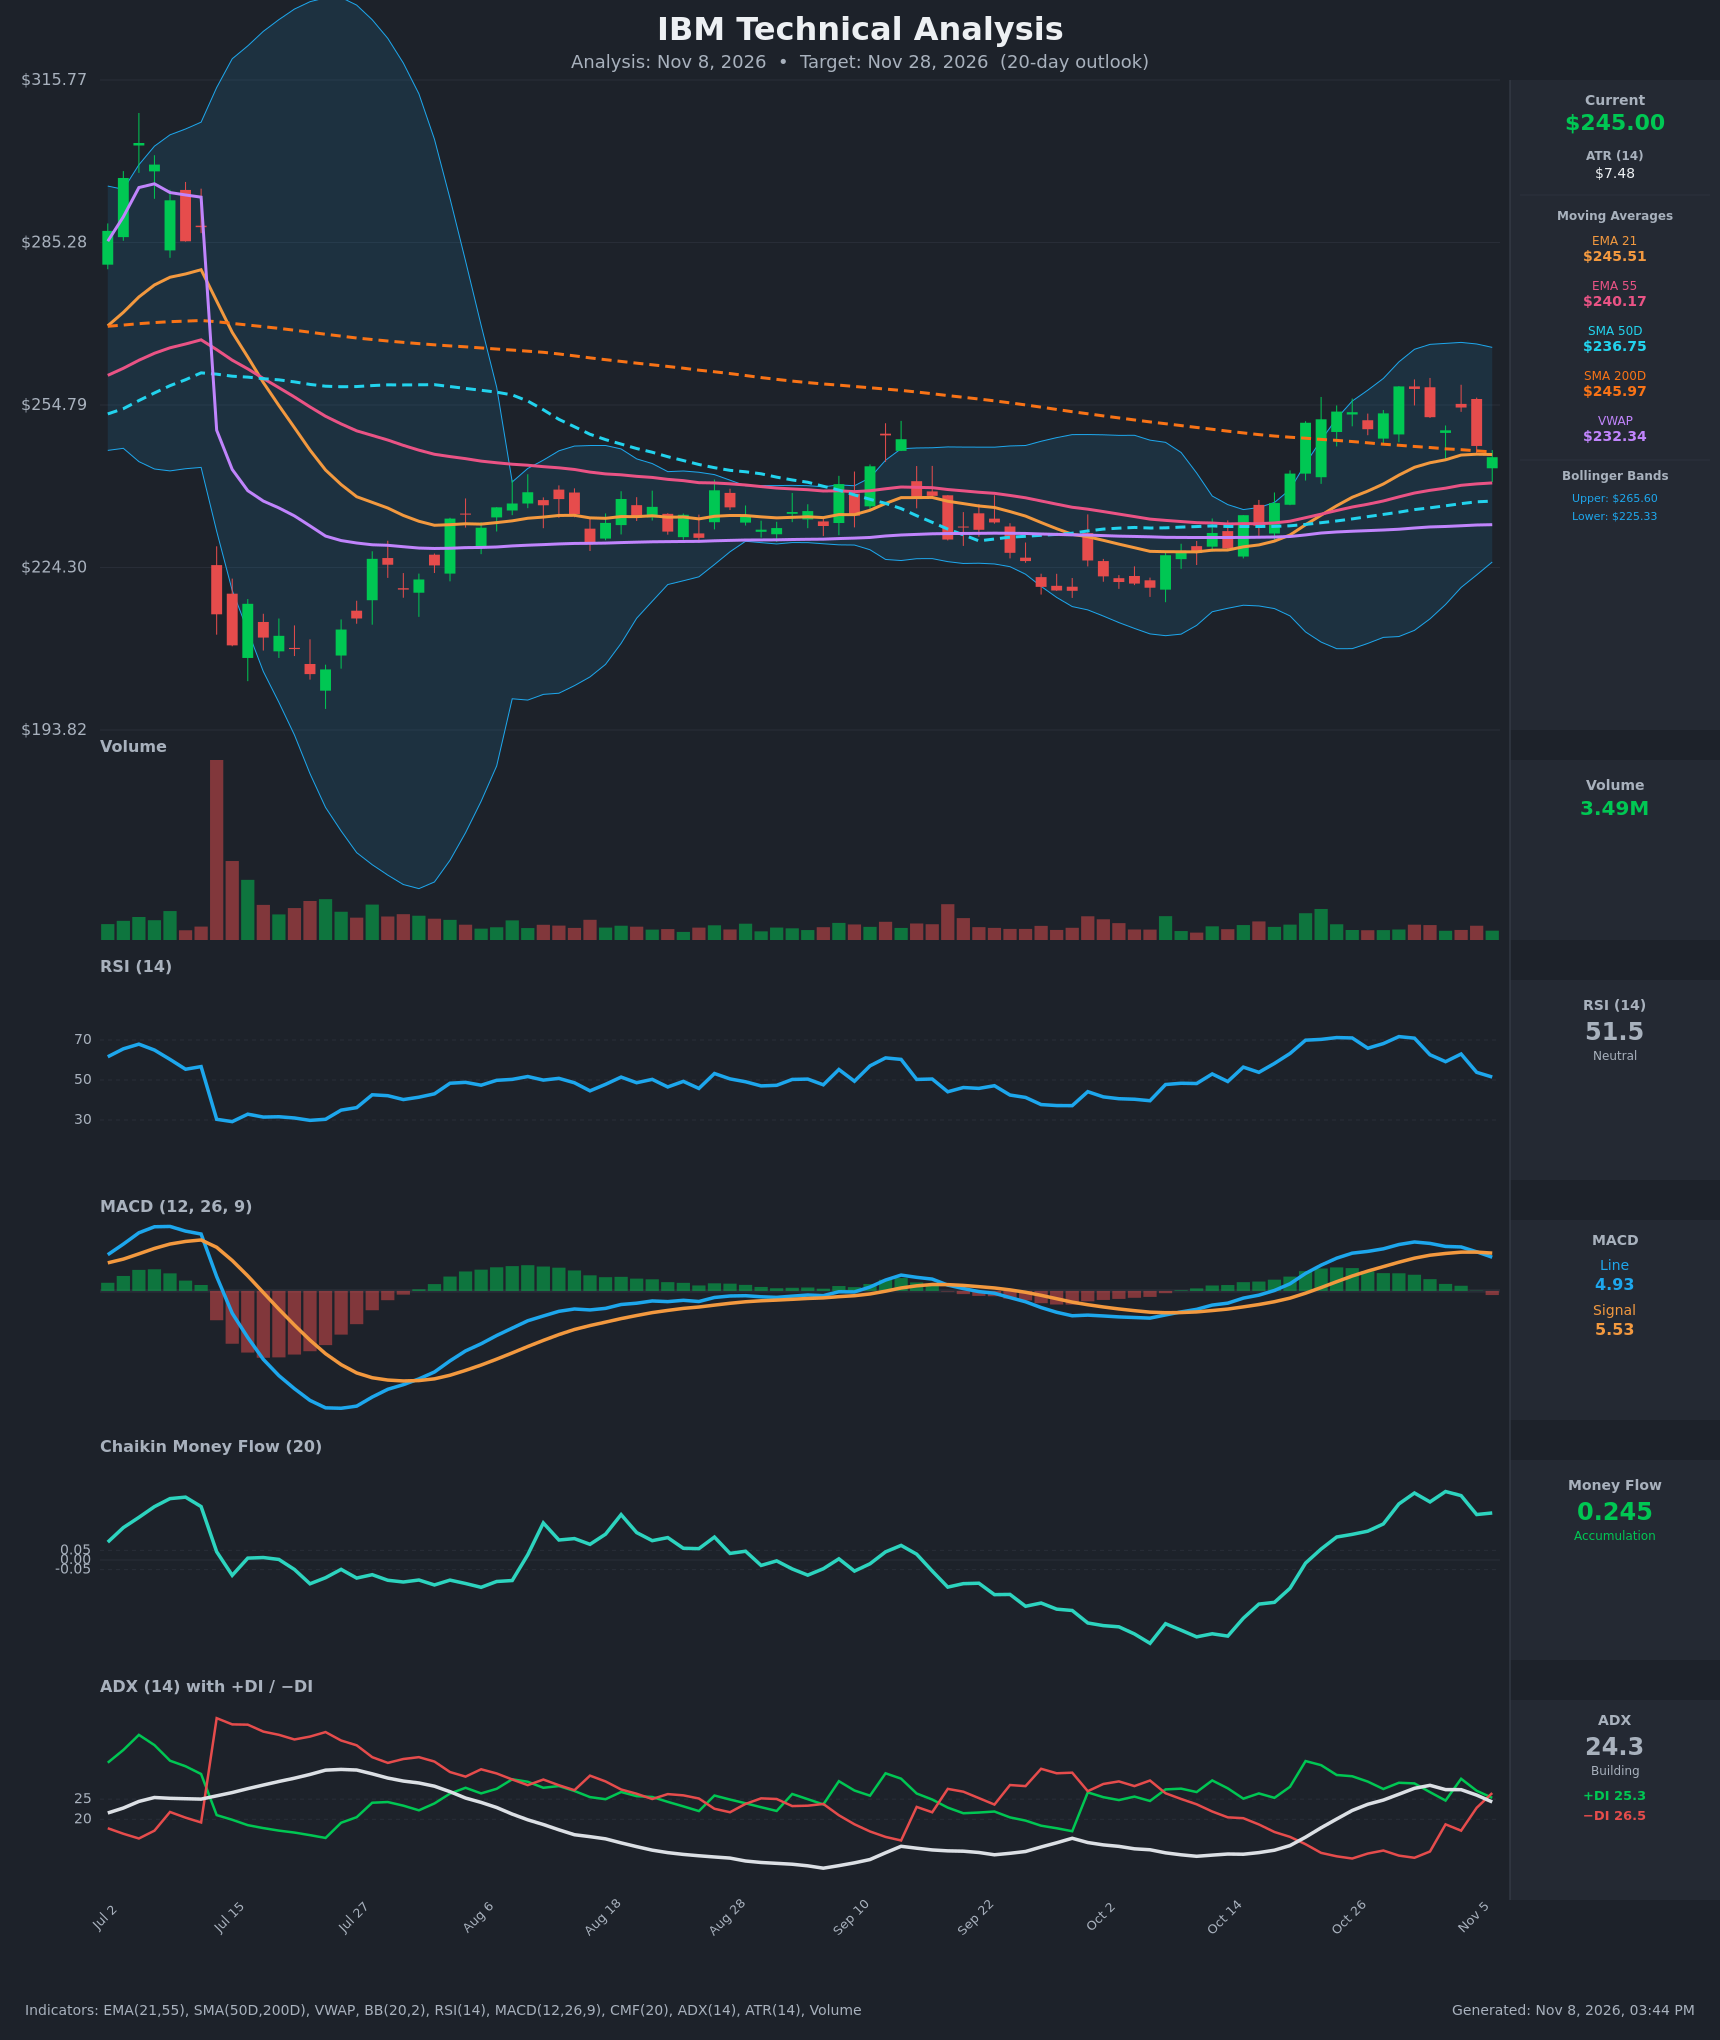
Analysis
TECHNICAL INDICATORS
- RSI (14): 51.5, down sharply from 71.7 on Oct 29 and now back at the midline. Momentum has rolled over from overbought but is not oversold, so there is room to fall further. [Neutral]
- 20 EMA: EMA21 is $245.51 and price is $245.00, just below it. EMA21 has flattened (245.40 → 245.56 → 245.51) and price has now lost it, so it acts as first resistance. EMA21 is still above EMA55 ($240.17), so the short-term uptrend structure is intact for now. [Neutral]
- MACD: Line 4.93 is below signal 5.53, a bearish crossover on Nov 6 (the line was above the signal from Oct 22). The histogram has turned negative and is falling, while both lines are still positive and well off the peak (7.16). [Bearish]
- Bollinger Bands (20): Upper $265.60, lower $225.33, midline about $245.5. Price sits right on the midline after rejecting the upper half. The bands are wide, so there is room for movement in either direction, but there is no squeeze or breakout. A loss of the midline leans toward the lower half of the bands. [Neutral]
- CMF (20): 0.245, still clearly in accumulation territory but off the 0.357 peak. The recent decline suggests buying pressure is fading, though there is no distribution yet. This is the main bullish counterweight. [Accumulation]
- ADX (14): 24.3, falling from 28.4, so the trend is weakening. −DI (26.5) has crossed above +DI (25.3) for the first time since early October, a bearish shift in control. The gap is small and ADX is below 25, so this is a weak trend with a slight bearish tilt. [Weak Trend, Bearish tilt]
- Volume: 3.49M, below the average of the recent rally days. The advance had decent volume (Oct 21–29), but the last few pullback candles show no strong distribution or capitulation. [Neutral / fading participation]
DIVERGENCES & TRENDS
- Momentum fade: Price made a higher high on Oct 29 ($258.28). RSI (71.7) and MACD (7.16) peaked around the same time and have since fallen faster than price. This is not a clean divergence, but momentum is clearly decaying.
- MACD crossover: The bearish cross (4.93 vs 5.53) is the freshest signal. Together with the DI cross (−DI 26.5 > +DI 25.3), it confirms a shift from bullish to bearish short-term momentum.
- SMA200D: SMA200D is $245.97 and falling. Price tested it from below, poked above it ($250–258) for about two weeks, and has now slipped back beneath it. That is a failed reclaim of the long-term trend line.
- SMA50D/200D: SMA50D ($236.75) is below SMA200D ($245.97), so there is no golden cross. The gap is narrowing but the long-term structure remains bearish.
- EMA stack: EMA21 > EMA55 > SMA50D, which is still bullish in order, but EMA21 is flattening and price is on it.
- CMF: CMF is rolling down from highs while price has pulled back. The accumulation is not yet reversing.
- ADX: ADX is rolling over from 28.4 and the trend is weakening.
CHART PATTERNS
- Bearish Double Top (loose): Highs at ~$258 (Oct 29–30) and ~$254 (Nov 4) with a neckline around $247–250. Price has now broken below the neckline. The measured move (~$8–10 from top to neckline) points to ~$238–241, which coincides with EMA55 ($240.17) and SMA50D ($236.75).
- Rejection at the declining SMA200D: Not a classic diagram pattern, but the broader trend since July (a lower-high sequence) still favors sellers.
- Bullish counter-argument: The Oct rally from ~$220 looks like a base breakout, and the current pullback could be a bullish flag or pennant. It would need to hold $240 and reclaim $250+ to validate.
POTENTIAL SCENARIOS
- Scenario 1: Bearish Pullback to the 50-Day — The MACD cross, DI flip, and double-top neckline break lead to a retracement of the Oct rally toward EMA55 and SMA50D. Trigger: close below $240.17 (EMA55). Target: $236–238, with an extension to ~$230 on weak market conditions. Invalidation: daily close above $250 with CMF re-expanding above 0.30. (50% probability)
- Scenario 2: Bullish Reclaim and Continuation — Price holds above $240, the pullback proves a flag, and buyers (CMF still +0.245) push back through the SMA200D. Trigger: close above $250 on rising volume. Target: $258–262, then upper band ~$265. Invalidation: close below $236.75. (28% probability)
- Scenario 3: Neutral Chop Around the Moving Averages — Price oscillates between EMA55 (~$240) and the SMA200D/prior highs (~$252) as ADX stays below 25. Trigger: no decisive close outside $240–252. Target: $243–247. Invalidation: a daily close outside the range. (22% probability)
PRICE TARGETS
- Target Price: $238.50 (20-day, by Nov 28, 2026)
- Expected Range: $226.00 to $252.00 (width $26 ≈ 10.6% of current price, consistent with the 14–21 day guidance)
- Key Levels: Support at $240.17 (EMA55), then $236.75 (SMA50D) and the lower band ~$225.33. Resistance at $245.97 (SMA200D/EMA21 zone), then $258.28 (recent high).
OVERALL BIAS
OVERALL BIAS: BEARISH - A fresh bearish MACD crossover, a −DI/+DI flip, fading RSI momentum, a failed reclaim of the SMA200D, and a loose double top with a neckline break favor a pullback toward EMA55/SMA50D (~$238). Still-positive CMF is the main risk to this view, so conviction is modest.
This is educational analysis and not financial advice.