IBIT 20-day bearish forecast — Nov 8, 2026
- Bias: Bearish
- Timeframe: 20 days (made Nov 8, 2026, target date Nov 27, 2026)
- Price at analysis: $42.88
- Price target: $41.60
- Expected range: $39.60 – $44.40
- Result: Pending — graded after the close on Nov 27, 2026
Get a free AI analysis of IBIT today
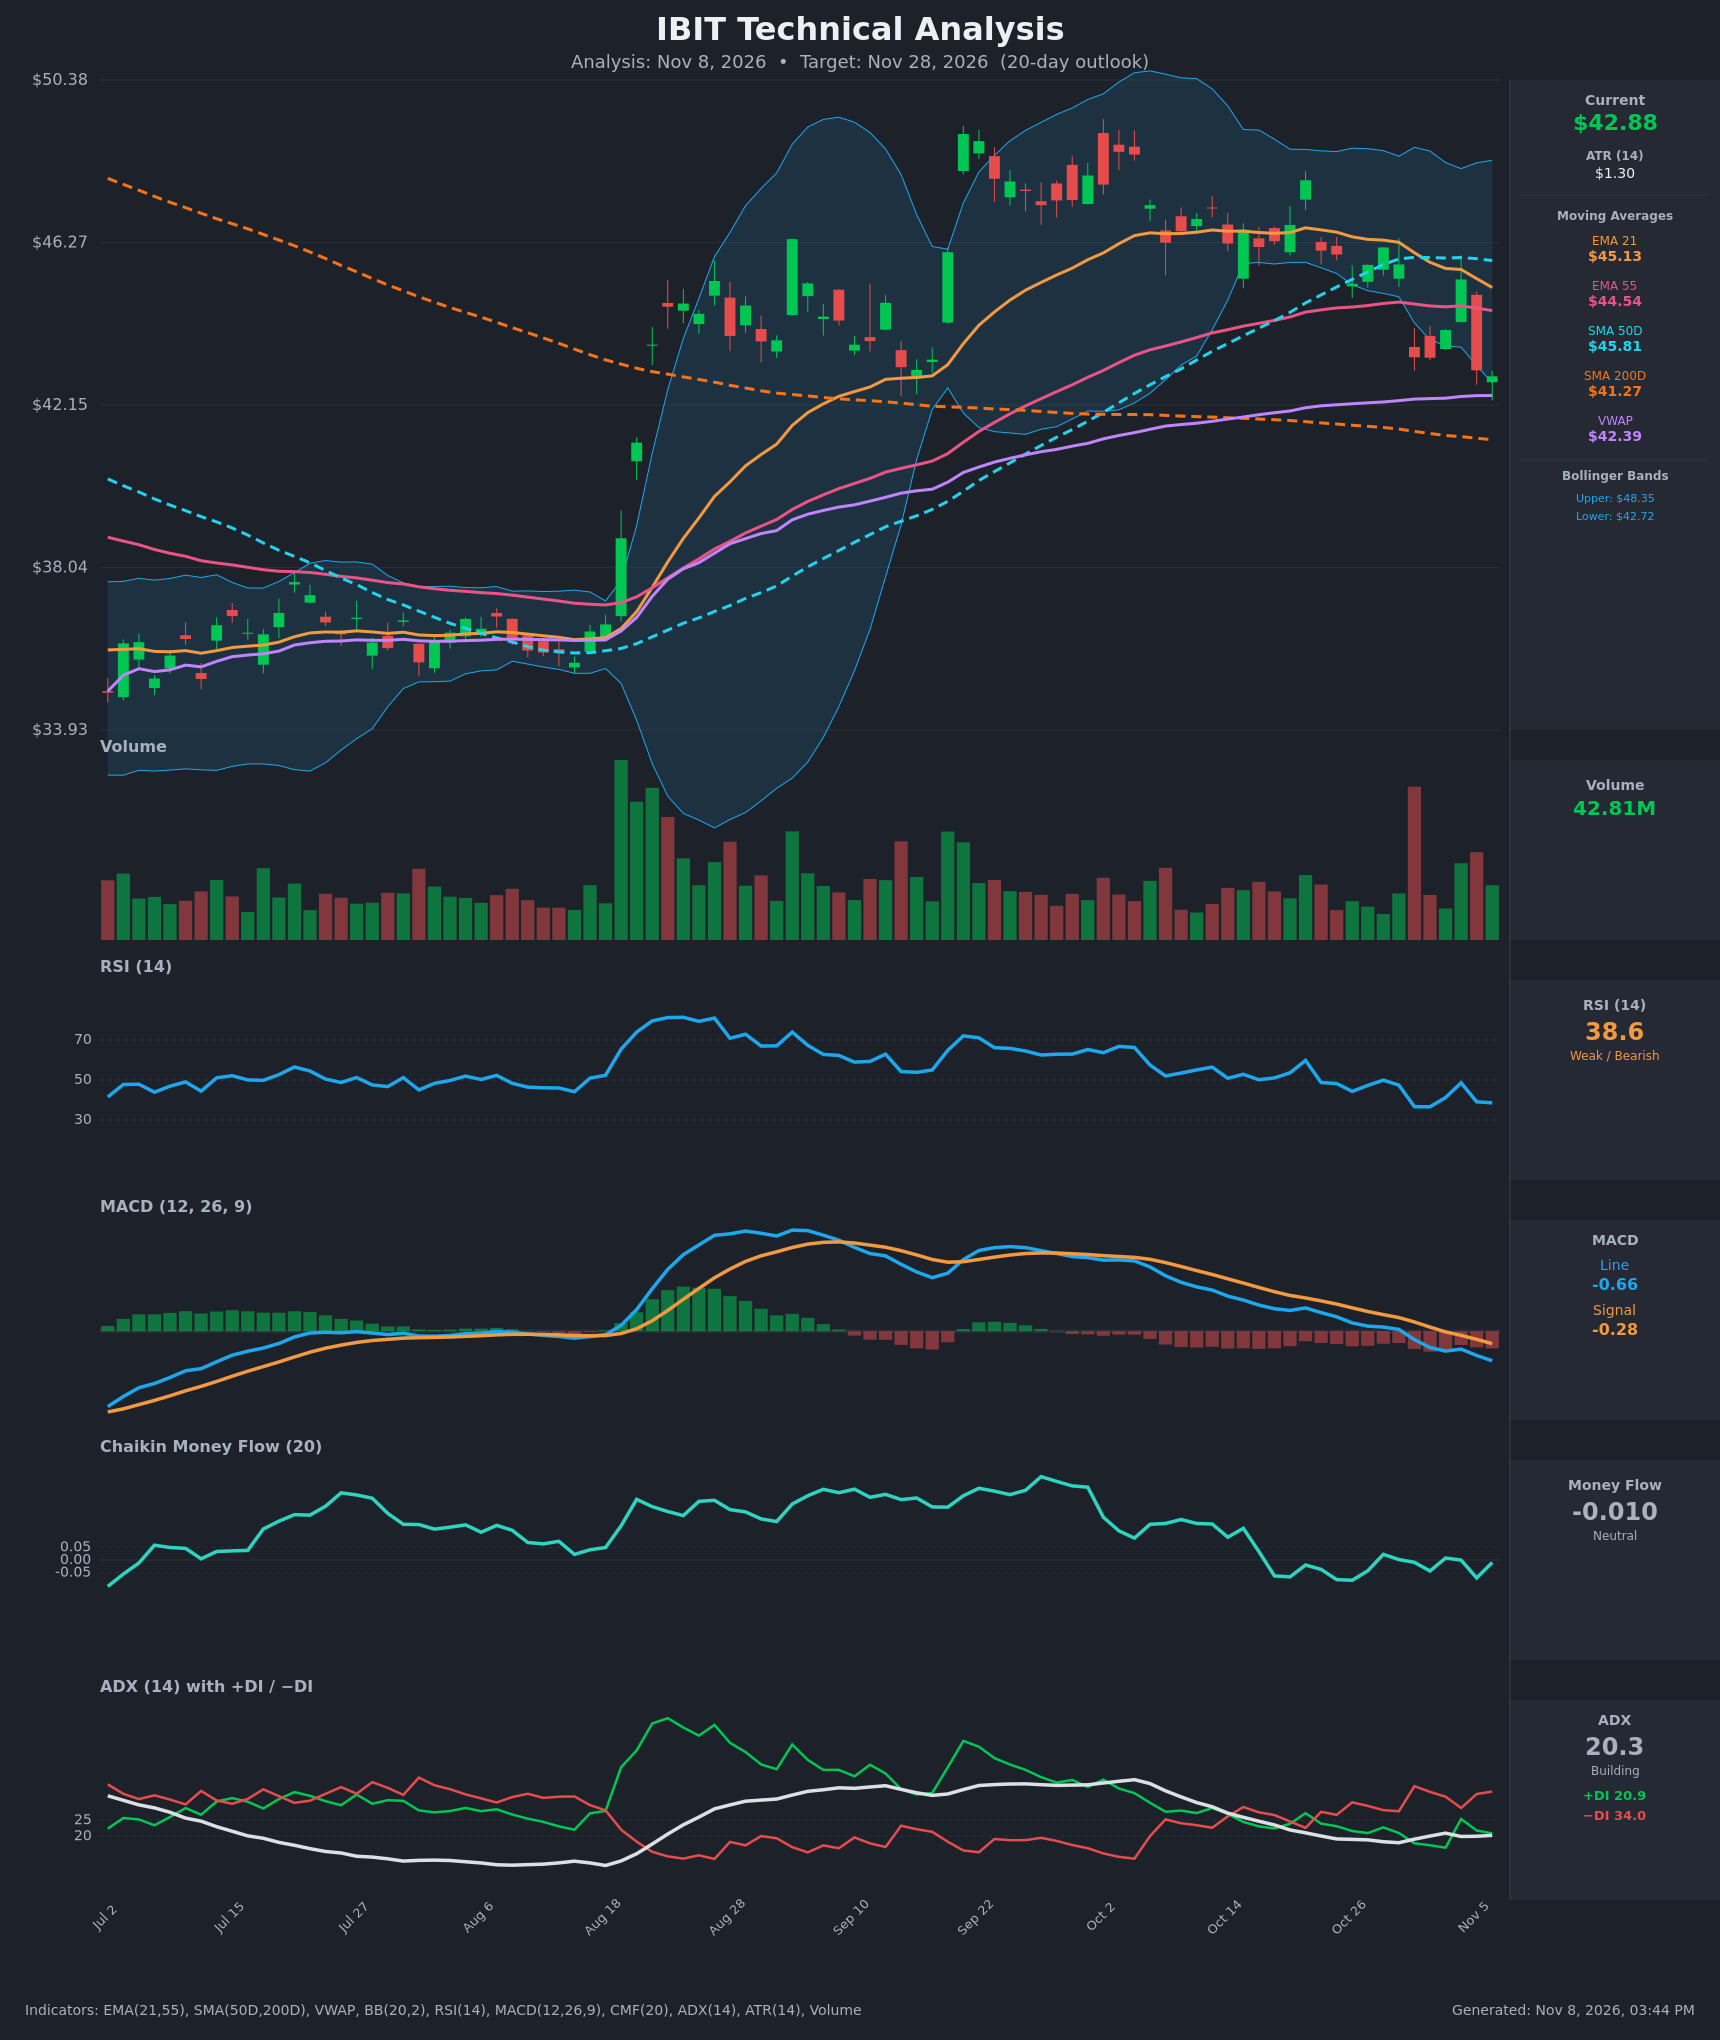
Analysis
TECHNICAL INDICATORS
- RSI (14): 38.57, down from about 50 in late October and below the 40 level. It is not yet oversold (<30), so there is room to fall further. Momentum is weak but not washed out. [Bearish]
- 20 EMA: The 21 EMA is $45.13 and price at $42.88 is about 5% below it. The EMA has been falling since Oct 19 and now acts as resistance. The 21 EMA is also converging on the 55 EMA ($44.54) and a bearish cross looks likely. [Bearish]
- MACD: The line is -0.663 and the signal is -0.279. The bearish crossover happened around Nov 3, both lines are now below zero, and the histogram is increasingly negative. Momentum is accelerating to the downside. [Bearish]
- Bollinger Bands (20): Price is at $42.88, hugging the lower band ($42.72), with the upper band at $48.35. The bands are contracting from the September expansion, and price is walking the lower band, which is a sign of downside pressure. A mean-reversion bounce toward the midline (~$45.5) is possible, but a clean close below the lower band would extend the move. [Bearish]
- CMF (20): -0.010 sits inside the neutral band (±0.05). It has deteriorated from a clearly positive reading (+0.2) in September to hovering around zero. Buyers have faded but heavy distribution is not confirmed. [Neutral]
- ADX (14): 20.3 and slowly rising from ~18, with −DI at 34.0 well above +DI at 20.9. The trend is not yet strong (<25), but the directional pressure is clearly with the bears, and a rising ADX with −DI dominant would confirm a downtrend. [Weak but Building Trend – Bearish]
- Volume: 42.81M, around or slightly above average. The large red bars on the Oct 30 and Nov 5 breakdown candles were heavier than the up-bar volume, which points to selling pressure. The latest small up candle on decent volume hints at some dip buying near VWAP and the SMA200. [Mildly Bearish]
DIVERGENCES & TRENDS
- There is no clear bullish divergence. RSI (38.6) and MACD are making lower highs and lower lows along with price, so momentum confirms the decline.
- Price has lost the 21 EMA, 55 EMA and 50-day SMA in sequence. The 21/55 EMA gap has narrowed from about $2.2 to $0.6, so a bearish EMA cross looks likely in the coming sessions.
- The 50-day SMA ($45.81) is now rolling over, but it is still well above the 200-day SMA ($41.27). The golden-cross structure is intact and there is no death cross.
- Price is still above the 200-day SMA ($41.27) and VWAP ($42.39). That is the last cluster of support, and price is now only about 1.2% above VWAP.
- The −DI crossed above +DI around Oct 22, and −DI has remained dominant since Oct 30.
- CMF has fallen from strongly positive to flat and negative, a sign of fading accumulation.
CHART PATTERNS
- Bearish Double Top (reversal): The September and early-October highs near $48–48.5 failed to extend, and the October rebound faded under $47.8. Price then broke the consolidation support around $45.3–$43.4. This is a loose double top with a neckline near $43.4–$43.0, which price has now broken on the Nov 5–6 closes. The measured move from the ~$48.3 peak to the ~$43.2 neckline implies about $5, so a target near $38–$39 is possible over a longer horizon. Within 20 days, the SMA200 area ($41.3) is the more likely first objective.
- Bearish Flag / Descending structure (continuation): The Oct 14 – Nov 4 bounce looks like a weak rebound inside a down-sloping channel. The failed retest of the 50-day SMA and EMAs followed by a sharp drop supports bearish continuation.
- Caveat: The pattern identifications are approximate. The key confirmation level is a close below the SMA200 ($41.27).
POTENTIAL SCENARIOS
- Scenario 1: Bearish Breakdown Toward the SMA200 — Price loses VWAP and the lower Bollinger Band, and the bearish MACD and −DI dominance push it toward the 200-day SMA, with a possible overshoot. Trigger: a daily close below $42.39 (VWAP), then below $42.00. Target: $41.27 first, then $39.60–$40.50. Invalidation: a daily close back above $45.13 (21 EMA). (50% probability)
- Scenario 2: Neutral/Corrective Bounce Within a Downtrend — The oversold-leaning RSI and the lower Bollinger Band trigger a relief rally, but the declining EMAs cap it. Price chops between the SMA200 and the 55 EMA. Trigger: a hold of $41.27–$42.40 with an RSI turn above 45. Target: $44.00–$44.54. Invalidation: a close below $41.27 or above $45.81. (30% probability)
- Scenario 3: Bullish Reversal — Buyers defend VWAP and the SMA200, MACD flattens, and price recovers the moving-average cluster. Trigger: a close above $45.13 on rising volume, with +DI crossing above −DI. Target: $46.50–$47.80. Invalidation: a close below $41.27. (20% probability)
PRICE TARGETS
- Target Price: $41.60 (20-day horizon)
- Expected Range: $39.60 to $44.40 (width $4.80 ≈ 11.2% of the current price, consistent with the 14–21 day guidance)
- Key Levels: Support at $41.27 (SMA200), Resistance at $44.54 (EMA55)
OVERALL BIAS
OVERALL BIAS: BEARISH - Price is below the 21 EMA, 55 EMA and 50-day SMA, MACD has crossed bearishly below zero, and −DI (34.0) dominates +DI (20.9) with ADX building. The breakdown from the double-top-like structure points toward the 200-day SMA (~$41.27), though that level and VWAP may produce a bounce along the way.
This is educational analysis and not financial advice.