GOOGL 20-day bearish forecast — Nov 8, 2026
- Bias: Bearish
- Timeframe: 20 days (made Nov 8, 2026, target date Nov 27, 2026)
- Price at analysis: $284.78
- Price target: $274.00
- Expected range: $258.00 – $294.00
- Result: Pending — graded after the close on Nov 27, 2026
Get a free AI analysis of GOOGL today
Analysis
TECHNICAL INDICATORS
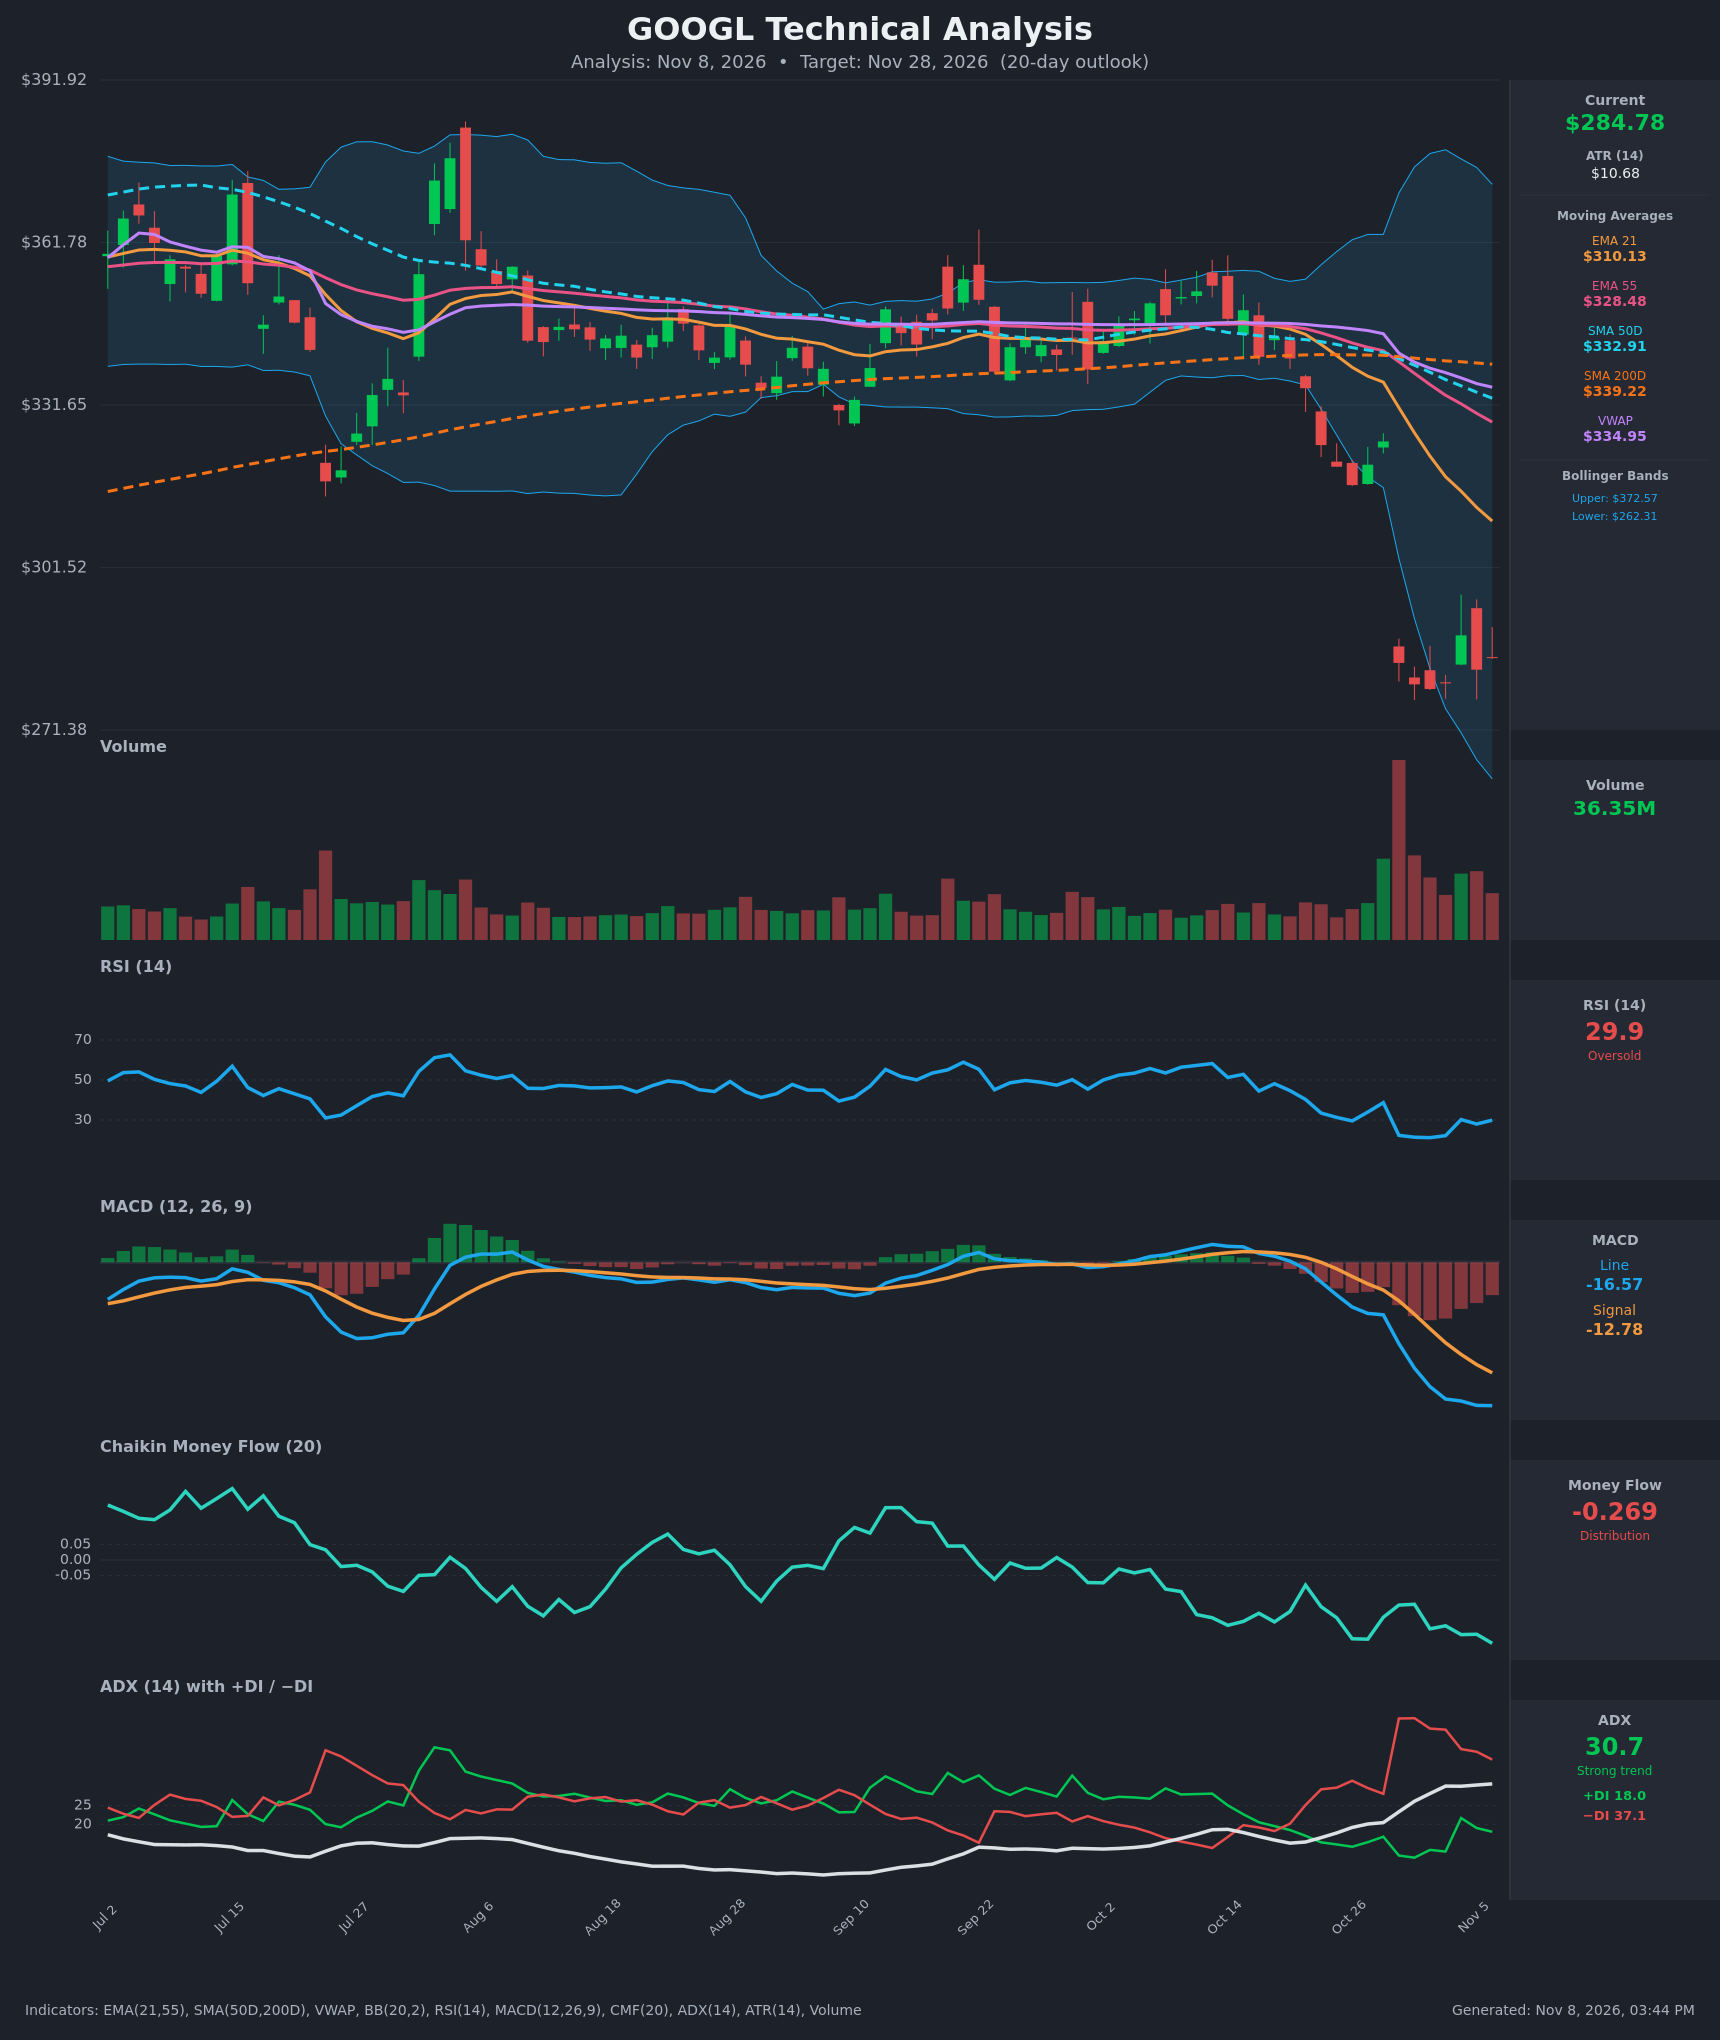
- RSI (14): 29.92, back at the oversold threshold. It bottomed near 21 on Nov 2 and bounced to 30 on Nov 4, but it is still pinned at 28-30 and has not reclaimed 40. Oversold readings in a strong trend often stay oversold, but the bounce attempt is real. [Neutral]
- 20 EMA: The supplied value is the EMA 21 at $310.13, with the EMA 55 at $328.48. Price at $284.78 is about 8% below the EMA 21, which has been falling steeply since Oct 19 and now acts as overhead resistance. The EMA 21 is below the EMA 55 and the gap is widening. [Bearish]
- MACD: The line is -16.57 against a signal of -12.78, so the histogram is about -3.8. The bearish crossover happened Oct 21, and the line has kept falling and widening below the signal. It is deeply negative, with no turn yet. [Bearish]
- Bollinger Bands (20): The upper band is $372.57 and the lower is $262.31, so the bands are very wide after the Oct 29 gap. Price is in the lower third, about $22 above the lower band. It traded near the band during the selloff and is now bouncing within a volatility-expanded range. A tight, small-bodied consolidation inside expanded bands is a pause, not a reversal. [Bearish]
- CMF (20): -0.269, well below -0.05 and near the lows of the whole chart. It has been negative since Oct 19 and keeps making new lows. That shows persistent distribution, with no accumulation on the bounce. [Distribution]
- ADX (14): 30.7 and rising from 15 on Oct 19, with −DI at 37.1 well above +DI at 18.0. The −DI crossover came on Oct 21, and the trend is strong with bears in control. [Strong Trend - Bearish]
- Volume: 36.35M on the latest bar. The Oct 29 gap came on by far the heaviest volume on the chart, and the red bars since have stayed above the pre-selloff average. The bounce bars are not on expanding volume. This is capitulation-scale selling with a lackluster rebound. [Bearish]
Moving-average structure is bearish too. Price is below the SMA 50 ($332.91), SMA 200 ($339.22), and VWAP ($334.95). A death cross occurred on Oct 29, when the SMA 50 dropped below the SMA 200.
DIVERGENCES & TRENDS
- RSI vs. price: There is a mild divergence. The price low was $278.99 on Nov 2 with RSI at 21.2, while price made roughly equal levels afterward ($280-285) with RSI at 28-30. This is a weak, early sign of selling exhaustion, not a confirmed bullish divergence.
- MACD: The line is still making new lows (-16.57) while price has stabilized. Momentum has not yet turned, so there is no bullish divergence.
- CMF: It keeps making new lows alongside price, so it confirms the downtrend rather than diverging.
- ADX/DI: ADX is rising through 30 with −DI dominant. This is a classic strong-downtrend reading. A +DI rebound (13 to 22 to 18) has been rejected so far.
- Crossovers: The EMA 21 is below the EMA 55, the death cross has occurred, and the MACD is below its signal. All three are bearish and none have reversed.
- Gap: The Oct 29 gap from ~$325 to ~$284 is unfilled. The gap zone ($320-325) is major resistance.
CHART PATTERNS
- Primary: bearish flag/pennant-style continuation. After the sharp gap-down (the flagpole), price has consolidated in a tight $279-$289 range for 6 sessions. By the reference diagram, a break below the consolidation points to a measured move lower. The pole is roughly $41, so a full measured move would approach the $240 area. That is aggressive for 20 days, so I treat it as an upper bound.
- Secondary: possible bullish falling wedge/base. The stabilizing price and the RSI bounce from 21 could form a base. This is not confirmed, because it needs a close above ~$289-$290 and then the EMA 21 area (~$310).
- The overall structure is a failed range breakdown: price fell out of a long consolidation near $345 (Aug-Oct) and is now trending below it.
POTENTIAL SCENARIOS
- Scenario 1: Bearish Continuation Lower — Price fails at the $289-$295 area, the bear flag resolves down, and sellers retest the lows. Trigger: daily close below $278.99 (the Nov 2 close low). Target: $262-$270, the lower Bollinger Band area. Invalidation: daily close above $296 with expanding volume. (50% probability)
- Scenario 2: Bullish Oversold Relief Bounce — The oversold RSI and the unfilled gap attract dip buyers, and price rallies toward the falling EMA 21. Trigger: close above $289 and then $296 on rising volume with the MACD histogram shrinking. Target: $305-$312 (EMA 21). Invalidation: close below $278. (35% probability)
- Scenario 3: Neutral Choppy Base — Price stays in a $275-$295 range as volatility contracts and the indicators reset. Trigger: failure to break either $279 or $292 for several sessions. Target: $280-$290. Invalidation: close outside the $275-$295 range. (15% probability)
PRICE TARGETS
Timeframe: 20 days (Nov 28, 2026). The range width is $36, about 12.6% of the current price, which fits the 14-21 day guidance.
- Target Price: $274.00
- Expected Range: $258.00 to $294.00
- Key Levels: Support at $262.31 (lower Bollinger Band), Resistance at $289.00 (Nov 4 bounce high, with the EMA 21 at $310.13 as the next major resistance)
OVERALL BIAS
OVERALL BIAS: BEARISH - Price sits well below every moving average after a death cross, with the MACD still falling, CMF at -0.27 (distribution), ADX at 30.7 and −DI roughly double +DI. The oversold RSI and the stabilization after the gap raise the odds of a relief bounce, but the evidence still favors trend continuation, with modest conviction.
This is educational analysis and not financial advice.