MSFT 20-day bullish forecast — Nov 8, 2026
- Bias: Bullish
- Timeframe: 20 days (made Nov 8, 2026, target date Nov 27, 2026)
- Price at analysis: $530.61
- Price target: $541.00
- Expected range: $505.00 – $560.00
- Result: Pending — graded after the close on Nov 27, 2026
Get a free AI analysis of MSFT today
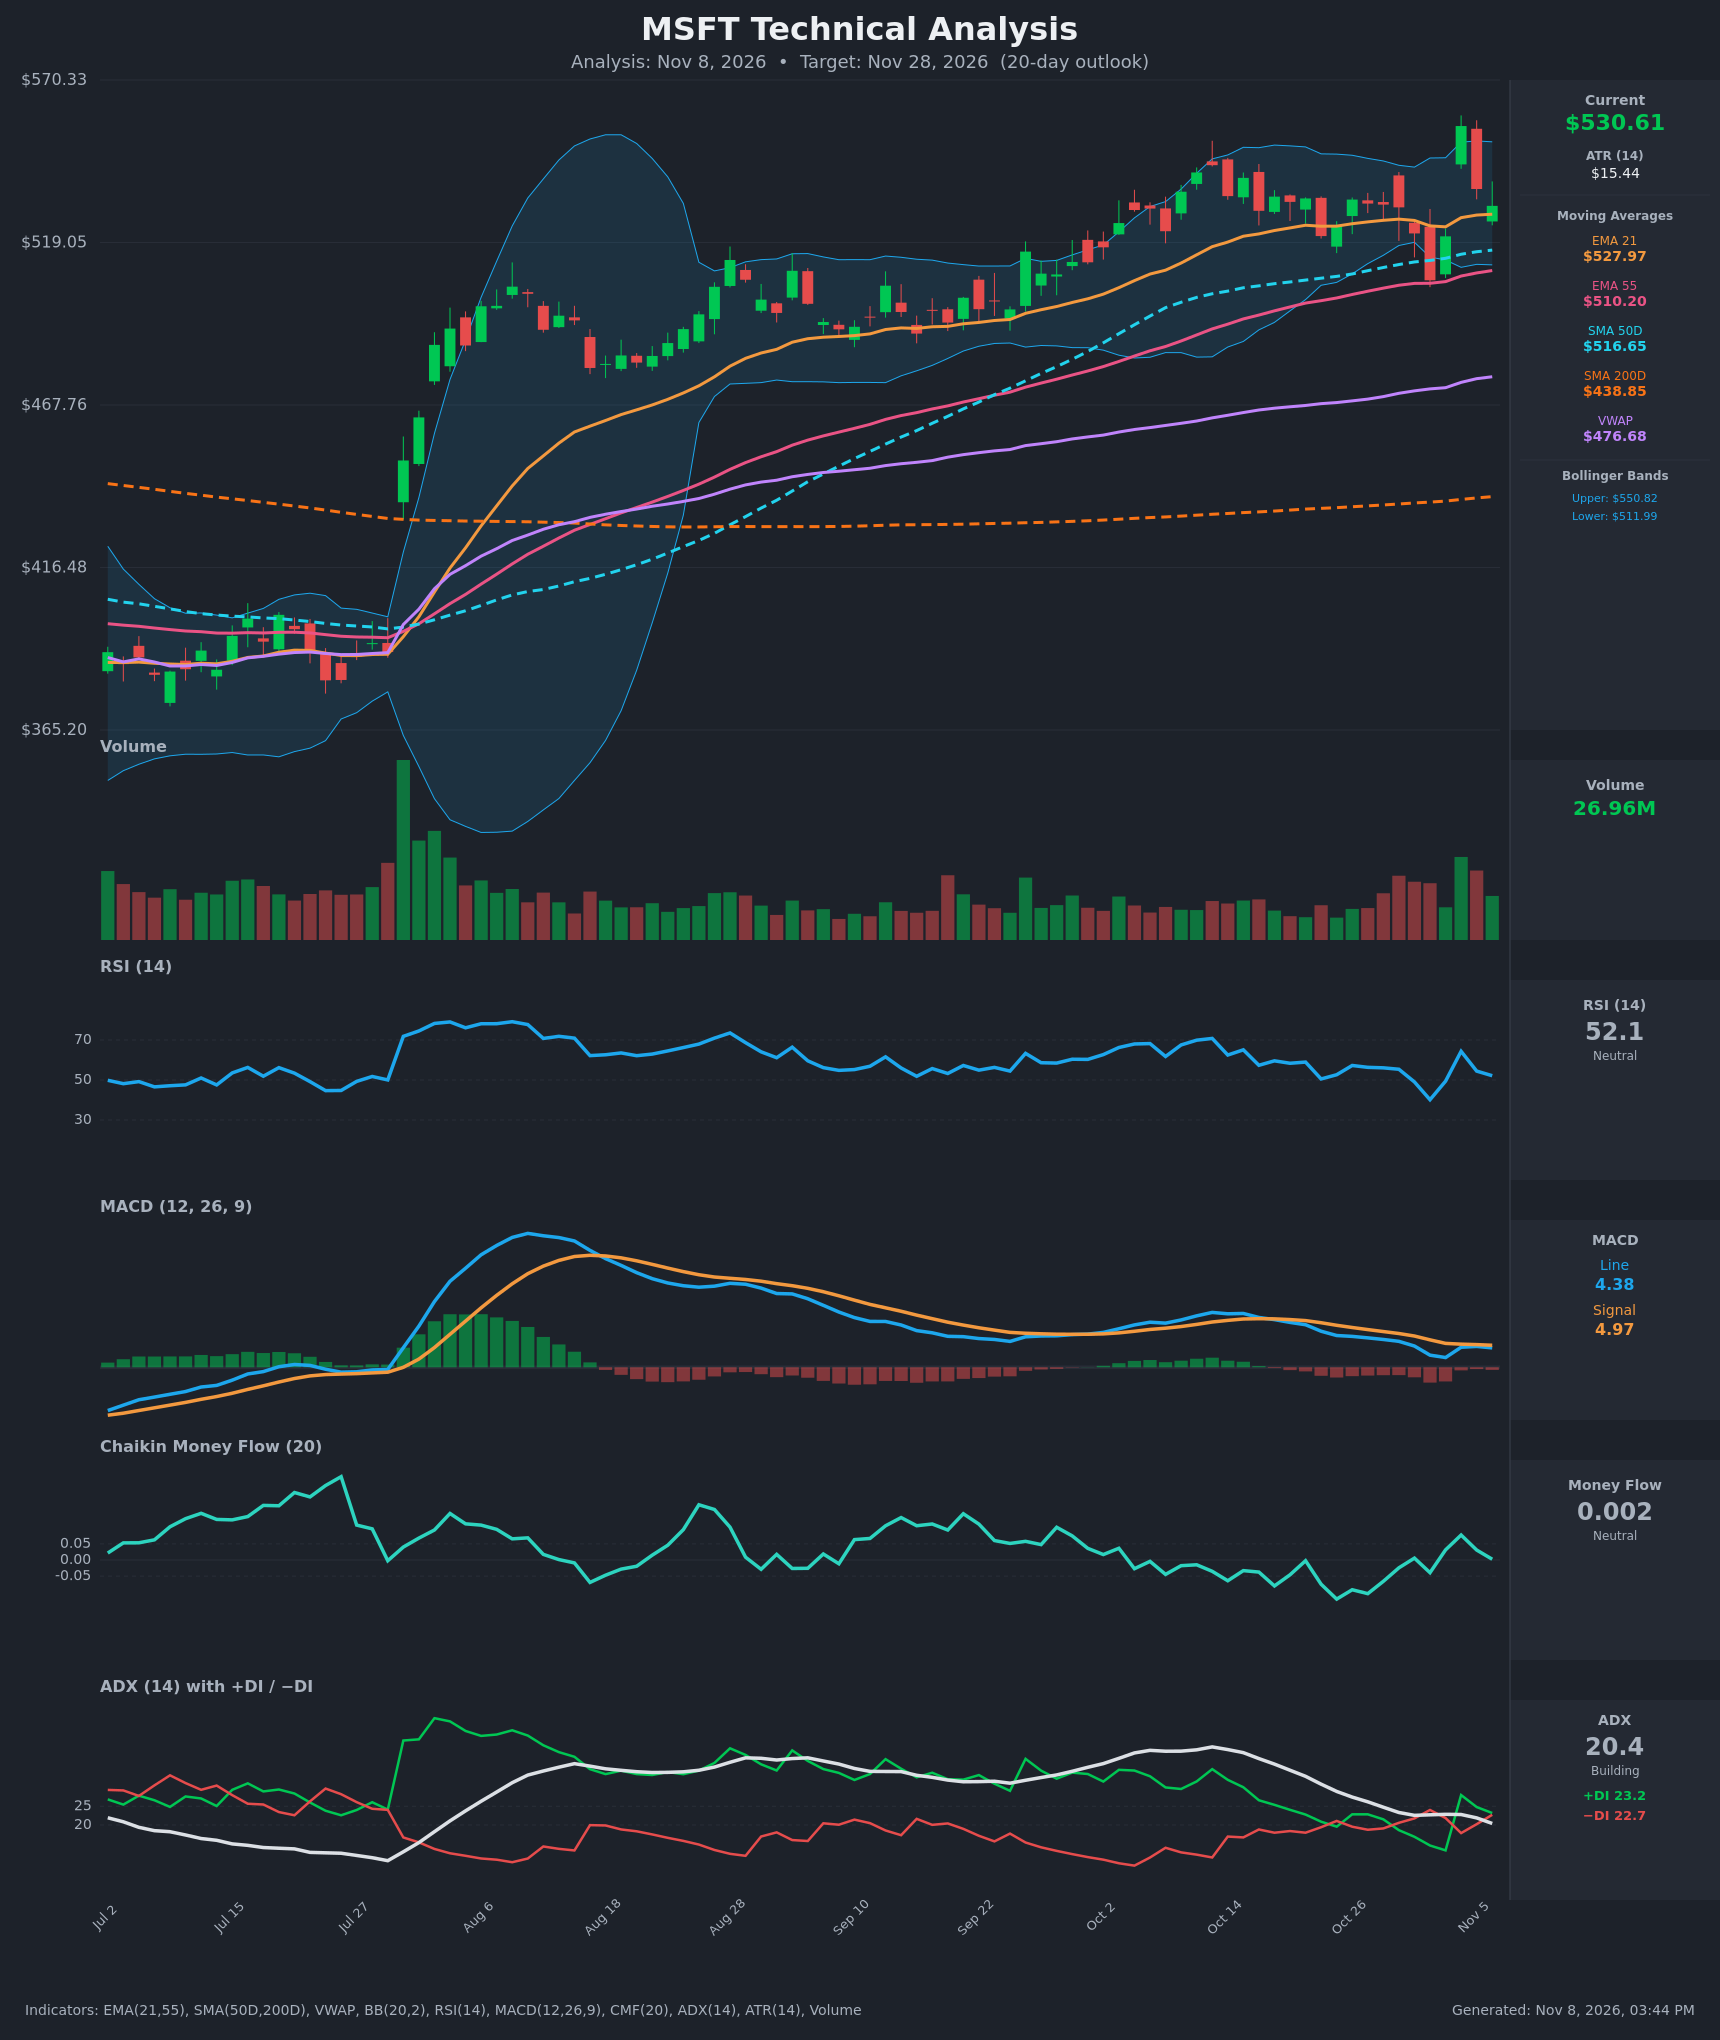
Analysis
TECHNICAL INDICATORS
- RSI (14): 52.15, neutral and mid-range. It bounced from 40.1 (Nov 2) to a 64.3 peak (Nov 4) and has since cooled. There is no overbought or oversold condition and no clear momentum edge. [Neutral]
- 20 EMA: The EMA 21 is $527.97 and price ($530.61) sits just above it, so it acts as marginal support. The EMA 21 is above the EMA 55 ($510.20) and is slowly rising. Price held it on the Nov 3 to Nov 6 pullbacks. [Bullish]
- MACD: The line (4.38) is below the signal (4.97), and the histogram is slightly negative at about -0.59. The bearish crossover occurred around Oct 14 to Oct 15, and the line is well off its 10+ peak. Both lines are still above zero, and the histogram has narrowed from -2.6 to -0.6 over the past week. This is fading momentum rather than a fresh breakdown. [Bearish]
- Bollinger Bands (20): Upper is $550.82, lower is $511.99, and the midline is about $531.4. Price sits almost exactly on the midline. The Nov 4 spike to $555.80 closed above the upper band and was rejected the next day. The bands are moderately narrow and flat, so volatility is contained and the market is consolidating. [Neutral]
- CMF (20): 0.002, inside the ±0.05 neutral band. It has oscillated between -0.12 and +0.08 over the past two weeks with no sustained accumulation or distribution. [Neutral]
- ADX (14): 20.4 and falling from 36 on Oct 19, at the weak-trend threshold. +DI (23.2) and −DI (22.7) are nearly tied, with +DI marginally on top after the Nov 4 surge. The earlier uptrend has lost strength and the market is range-bound. [Weak Trend, marginally bullish]
- Volume: 26.96M on the latest bar. The Nov 4 spike came on heavy volume and was a large reversal bar. Volume has been mixed since, with no decisive expansion either way. [Neutral, indecision]
DIVERGENCES & TRENDS
- Long-term trend: Price is above every major average: SMA50D $516.65, SMA200D $438.85, EMA 55 $510.20 and VWAP $476.68. The golden cross is long established, since the SMA50 has been above the SMA200 for months. This is a structurally bullish backdrop.
- Momentum divergence: Price has made higher highs since mid-October, topping at $555.80 on Nov 4, while MACD peaked in mid-October at about 11. That is a mild bearish momentum divergence. Price has gone sideways rather than falling, so it reads as consolidation.
- Trend strength: ADX has dropped from 36 to 20, so the trend is decaying into a range. The DI lines have converged after −DI briefly led on Nov 2.
- Crossovers: MACD is below its signal (bearish). The EMA 21 is above the EMA 55 and the SMA50 is above the SMA200 (bullish). Price has been oscillating around the EMA 21.
- Support behavior: The Nov 2 low ($507.12) was bought aggressively, with a +$48 rebound in two sessions. This shows dip-buying demand near the EMA 55 and SMA50 zone.
CHART PATTERNS
- Consolidation range: Since mid-October, price has traded roughly $507 to $556, with most closes between $520 and $535. This is a broad range or rectangle within an uptrend, which fits a continuation structure such as a Bullish Flag or an Ascending Triangle-style base. Higher lows from the SMA50 and EMA 55 support this reading. A breakout above $556 would project roughly $570 to $580, based on the range height of about $45 to $50.
- Bearish risk: The Nov 4 spike and reversal resembles a failed breakout, a bull trap, near the upper Bollinger Band. This is also part of a possible Bearish Double Top, with the Oct 14 high of about $540 and the Nov 4 spike near $556. It is not confirmed unless $507 to $511 breaks.
- Net: There is no clean reversal pattern. The dominant read is a continuation base inside an uptrend.
POTENTIAL SCENARIOS
- Scenario 1: Bullish Range Resolution Higher — Price holds the EMA 21 and SMA50 zone, the MACD histogram turns positive, and buyers push back toward the upper Bollinger Band and the Nov 4 spike high. Trigger: close above $536 to $540 with CMF above +0.05, then a break of $556. Target: $545 to $560 within 20 days, with $541 as the central estimate. Invalidation: daily close below $511 (lower band, EMA 55 area). (45% probability)
- Scenario 2: Neutral Continued Consolidation — Price chops between support and resistance as ADX stays near or below 20 and the failed breakout caps rallies. Trigger: repeated rejections near $540 to $556 and holds near $516 to $520. Target: $515 to $545. Invalidation: close above $556 or below $507. (30% probability)
- Scenario 3: Bearish Failed Breakout Breakdown — The Nov 4 reversal marks a short-term top, the MACD signal deficit widens, and −DI retakes the lead. Trigger: close below $516.65 (SMA50) and then $507. Target: $495 to $505, with the EMA 55 and SMA50 zone as the first test. Invalidation: reclaim of $535 on volume. (25% probability)
PRICE TARGETS
- Target Price: $541.00 (20-day horizon, about +2.0% from $530.61)
- Expected Range: $505.00 to $560.00 (width $55, about 10.4% of current price, consistent with the 14-21 day guidance of 8-12%)
- Key Levels: Support at $516.65 (SMA50D; below that, $511.99 lower Bollinger Band and $507.12 swing low), Resistance at $555.80 (Nov 4 spike high, with $550.82 upper Bollinger Band as first resistance)
OVERALL BIAS
OVERALL BIAS: BULLISH - Price is above all major moving averages, the EMA 21 > EMA 55 and SMA50 > SMA200 stack is intact, and dips have been bought near the SMA50 and EMA 55. Modest conviction only: the MACD is below its signal, ADX is weak at 20.4, and CMF is flat, so a range-bound outcome is a real possibility.
This is educational analysis and not financial advice.