NFLX 20-day bearish forecast — Nov 8, 2026
- Bias: Bearish
- Timeframe: 20 days (made Nov 8, 2026, target date Nov 27, 2026)
- Price at analysis: $63.41
- Price target: $60.80
- Expected range: $57.50 – $65.50
- Result: Pending — graded after the close on Nov 27, 2026
Get a free AI analysis of NFLX today
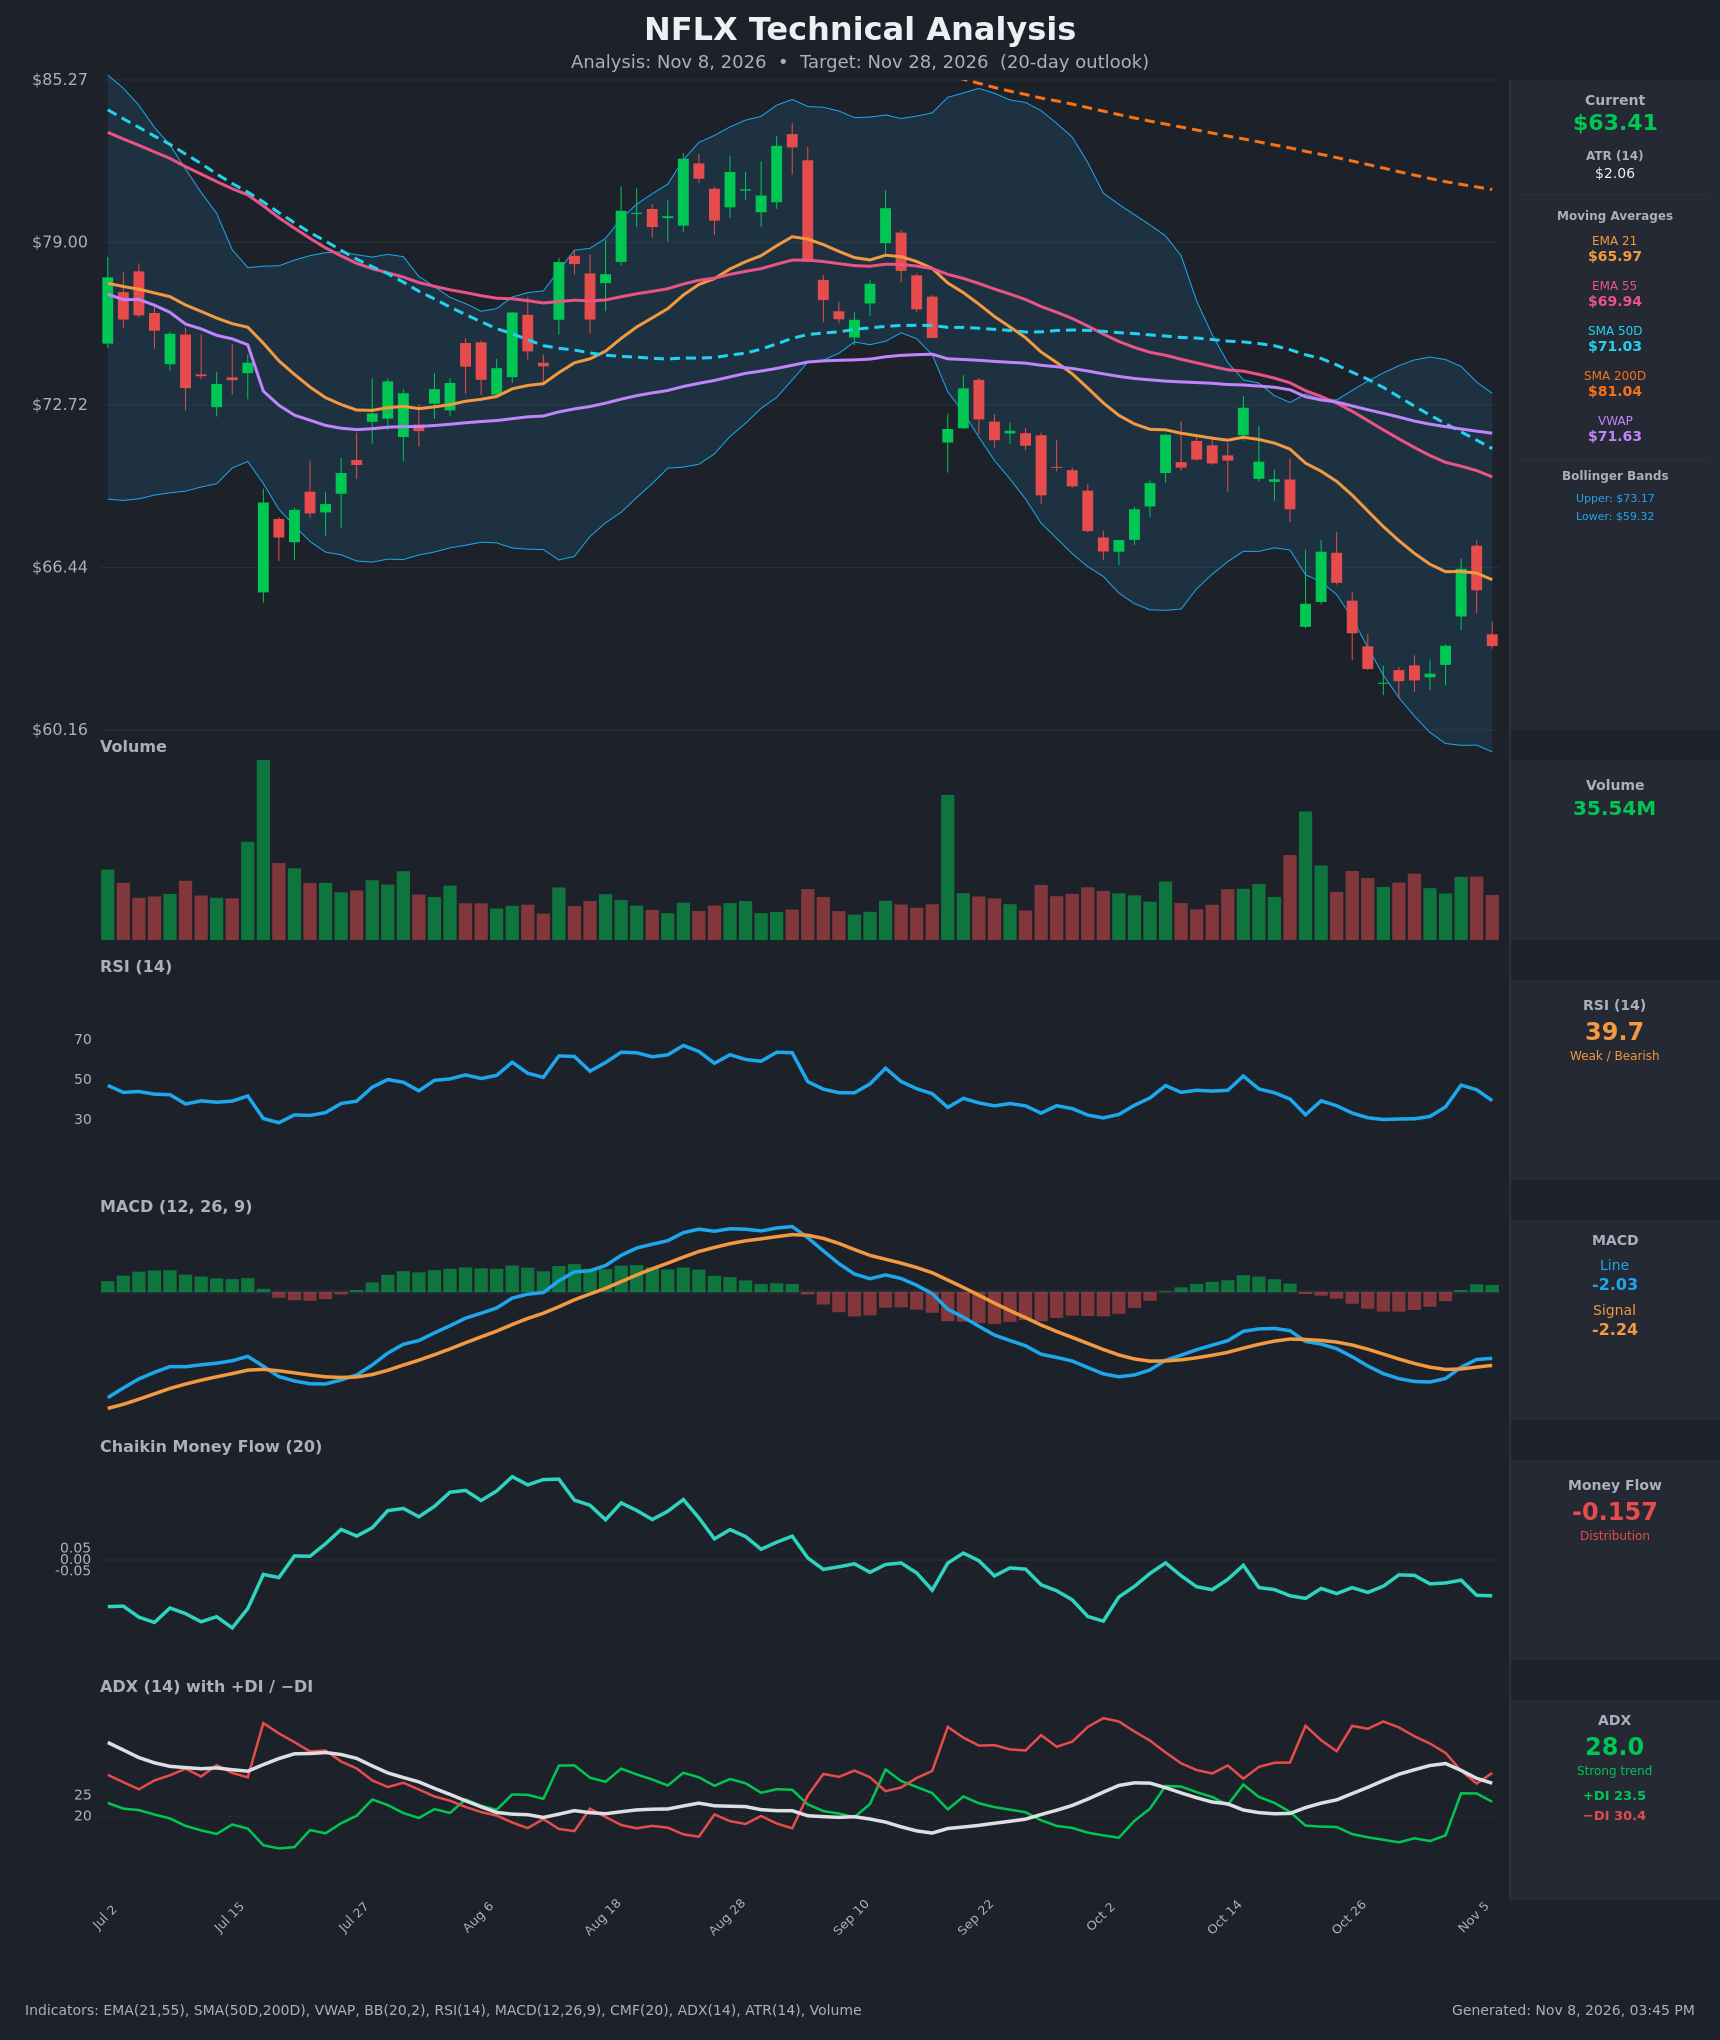
Analysis
TECHNICAL INDICATORS
- RSI (14): 39.68, below the 50 midline and rolling over from 47.5 on Nov 4. It has been below 40 for most of the past three weeks and touched 30 on Oct 28-30 without reaching a deeper oversold level. Momentum is weak but not washed out. [Bearish]
- 20 EMA: The closest equivalent is EMA 21 at $65.97, with price at $63.41 below it. EMA 21 is below EMA 55 ($69.94) and still sloping down. Price briefly poked above it on Nov 4 ($66.39) and was rejected. The EMA now acts as resistance. [Bearish]
- MACD: Line -2.03, signal -2.24, so the line sits slightly above the signal. A bullish crossover occurred on Nov 4, and the histogram is a small positive +0.21. Both lines are deeply negative, and the line has flattened (-2.07 to -2.03) while price dropped on Nov 6. This is a weak, tentative bounce signal that is fading. [Neutral]
- Bollinger Bands (20): Upper $73.17, lower $59.32, midline about $66.25. Price at $63.41 is in the lower half, about 30% of the band width above the lower band. The bands are wide, which reflects the recent selloff. Price has been walking the lower half since mid-October. The midline coincides with EMA 21 as resistance. [Bearish]
- CMF (20): -0.157, well below the -0.05 threshold and persistently negative since late September. There is no sign of accumulation on the bounce. [Distribution]
- ADX (14): 28.0, above 25 but off the 32.7 peak and declining. −DI (30.4) is above +DI (23.5). +DI briefly spiked on the Nov 4 bounce and has since faded. The downtrend is established but its strength is slightly waning. [Strong Trend – Bearish]
- Volume: 35.54M on the latest bar, in line with the recent average. It is well below the spike of the Oct 26-27 capitulation. The Nov 4 bounce came on average volume with no strong follow-through. Volume has been heavier on down days. [Neutral to mildly Bearish]
DIVERGENCES & TRENDS
- Moving averages: Price is below EMA 21, EMA 55, SMA 50D ($71.03), SMA 200D ($81.04) and VWAP ($71.63). The stack is fully bearish: EMA 21 < EMA 55 < SMA 50 < SMA 200. The SMA 50D is well below the SMA 200D, so a death cross has already occurred. The gap between price and VWAP (~11%) is a stretched, bearish reading.
- Divergences: Price made a lower low on Oct 28 while RSI bottomed near 30 with a flat base. Price and RSI have not diverged meaningfully. MACD printed a higher low against price (-2.75 versus the deeper price low), which is a mild bullish divergence that produced the Nov 4 bounce.
- Failed bounce: The Nov 4 bounce to $66.39 was rejected at EMA 21, and the subsequent two bars gave back most of the gain (to $63.41). That is a classic "sell the rip" sign in a downtrend.
- Trend: CMF has been negative for weeks, and −DI has been on top since mid-October. The trend of lower highs and lower lows from the September peak (~$80+) is intact.
CHART PATTERNS
- Bearish trend from the Sept high: After the roll over from ~$80, price carved a sequence of lower highs and lower lows, which is a classic downtrend channel.
- Possible Bullish Falling Wedge / Double Bottom (reversal candidates): Price formed lows near $61.99-$62.08 (Oct 28-30) and the Nov 2 close of $62.34 reinforces that area. A double-bottom-type base is forming around $61.5-$62. The reference double bottom needs a confirmed break above the neckline (the Nov 4 high of ~$66.4 and EMA 21 at ~$66), which has not happened. Its measured move would be about $4.5, to roughly $70.
- Bearish Pennant / Flag read: The Nov 4-6 bounce and pullback look like a small bear-flag-style consolidation after the October drop. A break below $62 would project toward ~$57-58.
- Verdict: The reversal base is unconfirmed, and the dominant structure is a downtrend. A break of the $62 support would negate the double-bottom case.
POTENTIAL SCENARIOS
- Scenario 1: Bearish Downtrend Continuation — Price fails below EMA 21 and retests/breaks the $62 base. The bearish stack, −DI dominance, negative CMF and failed bounce favor continued selling toward the lower Bollinger Band and below. Trigger: close below $61.90 on rising volume. Target: $58.00-$59.50. Invalidation: daily close above $66.40 (EMA 21 and the Nov 4 high). (50% probability)
- Scenario 2: Neutral Base-Building Range — Price holds the $61.90-$62.50 double-bottom area and chops between $62 and $66 as ADX fades and RSI resets. Trigger: repeated holds of $62 with declining ADX. Target: $62-$66 range. Invalidation: close outside either end of the range. (28% probability)
- Scenario 3: Bullish Relief Rally / Double Bottom Breakout — The MACD bullish cross and base support spark a rally through the $66.4 neckline. Trigger: close above $66.40 with volume expansion and CMF turning up. Target: $69-$70 (EMA 55 / measured move). Invalidation: close back below $62. (22% probability)
PRICE TARGETS
For the 20-day timeframe (target date Nov 28, 2026), the range width should be ~8-12% of the current price, so about $5-7.5 wide. I use a range of $59.00 to $66.00, which is $7.00 wide (about 11%). The target sits modestly below the current price, reflecting a continued downtrend with a possible bounce attempt along the way. ATR of $2.06 supports about $6-7 of movement over 20 trading days at the edges.
- Target Price: $60.80 (20-day target)
- Expected Range: $57.50 to $65.50 (width $8.00, about 12.6%)
- Key Levels: Support at $61.90, Resistance at $66.00
Note on the range check: a width of $8.00 is about 12.6% of $63.41, slightly above the 8-12% guide. I accept it because ATR is elevated and the band is wide, and the lower bound ($57.50) covers a breakdown of the $62 base.
OVERALL BIAS
OVERALL BIAS: BEARISH - Price is below every major moving average and VWAP with −DI above +DI at ADX 28, CMF is deeply negative (-0.157), and the Nov 4 bounce failed at EMA 21 despite a brief MACD bullish cross. The $61.90-$62 base is the line in the sand, and a break below it opens the way toward $58-59.
This is educational analysis and not financial advice.