NBIS 20-day bearish forecast — Nov 8, 2026
- Bias: Bearish
- Timeframe: 20 days (made Nov 8, 2026, target date Nov 27, 2026)
- Price at analysis: $129.49
- Price target: $120.50
- Expected range: $114.00 – $129.00
- Result: Pending — graded after the close on Nov 27, 2026
Get a free AI analysis of NBIS today
Analysis
TECHNICAL INDICATORS
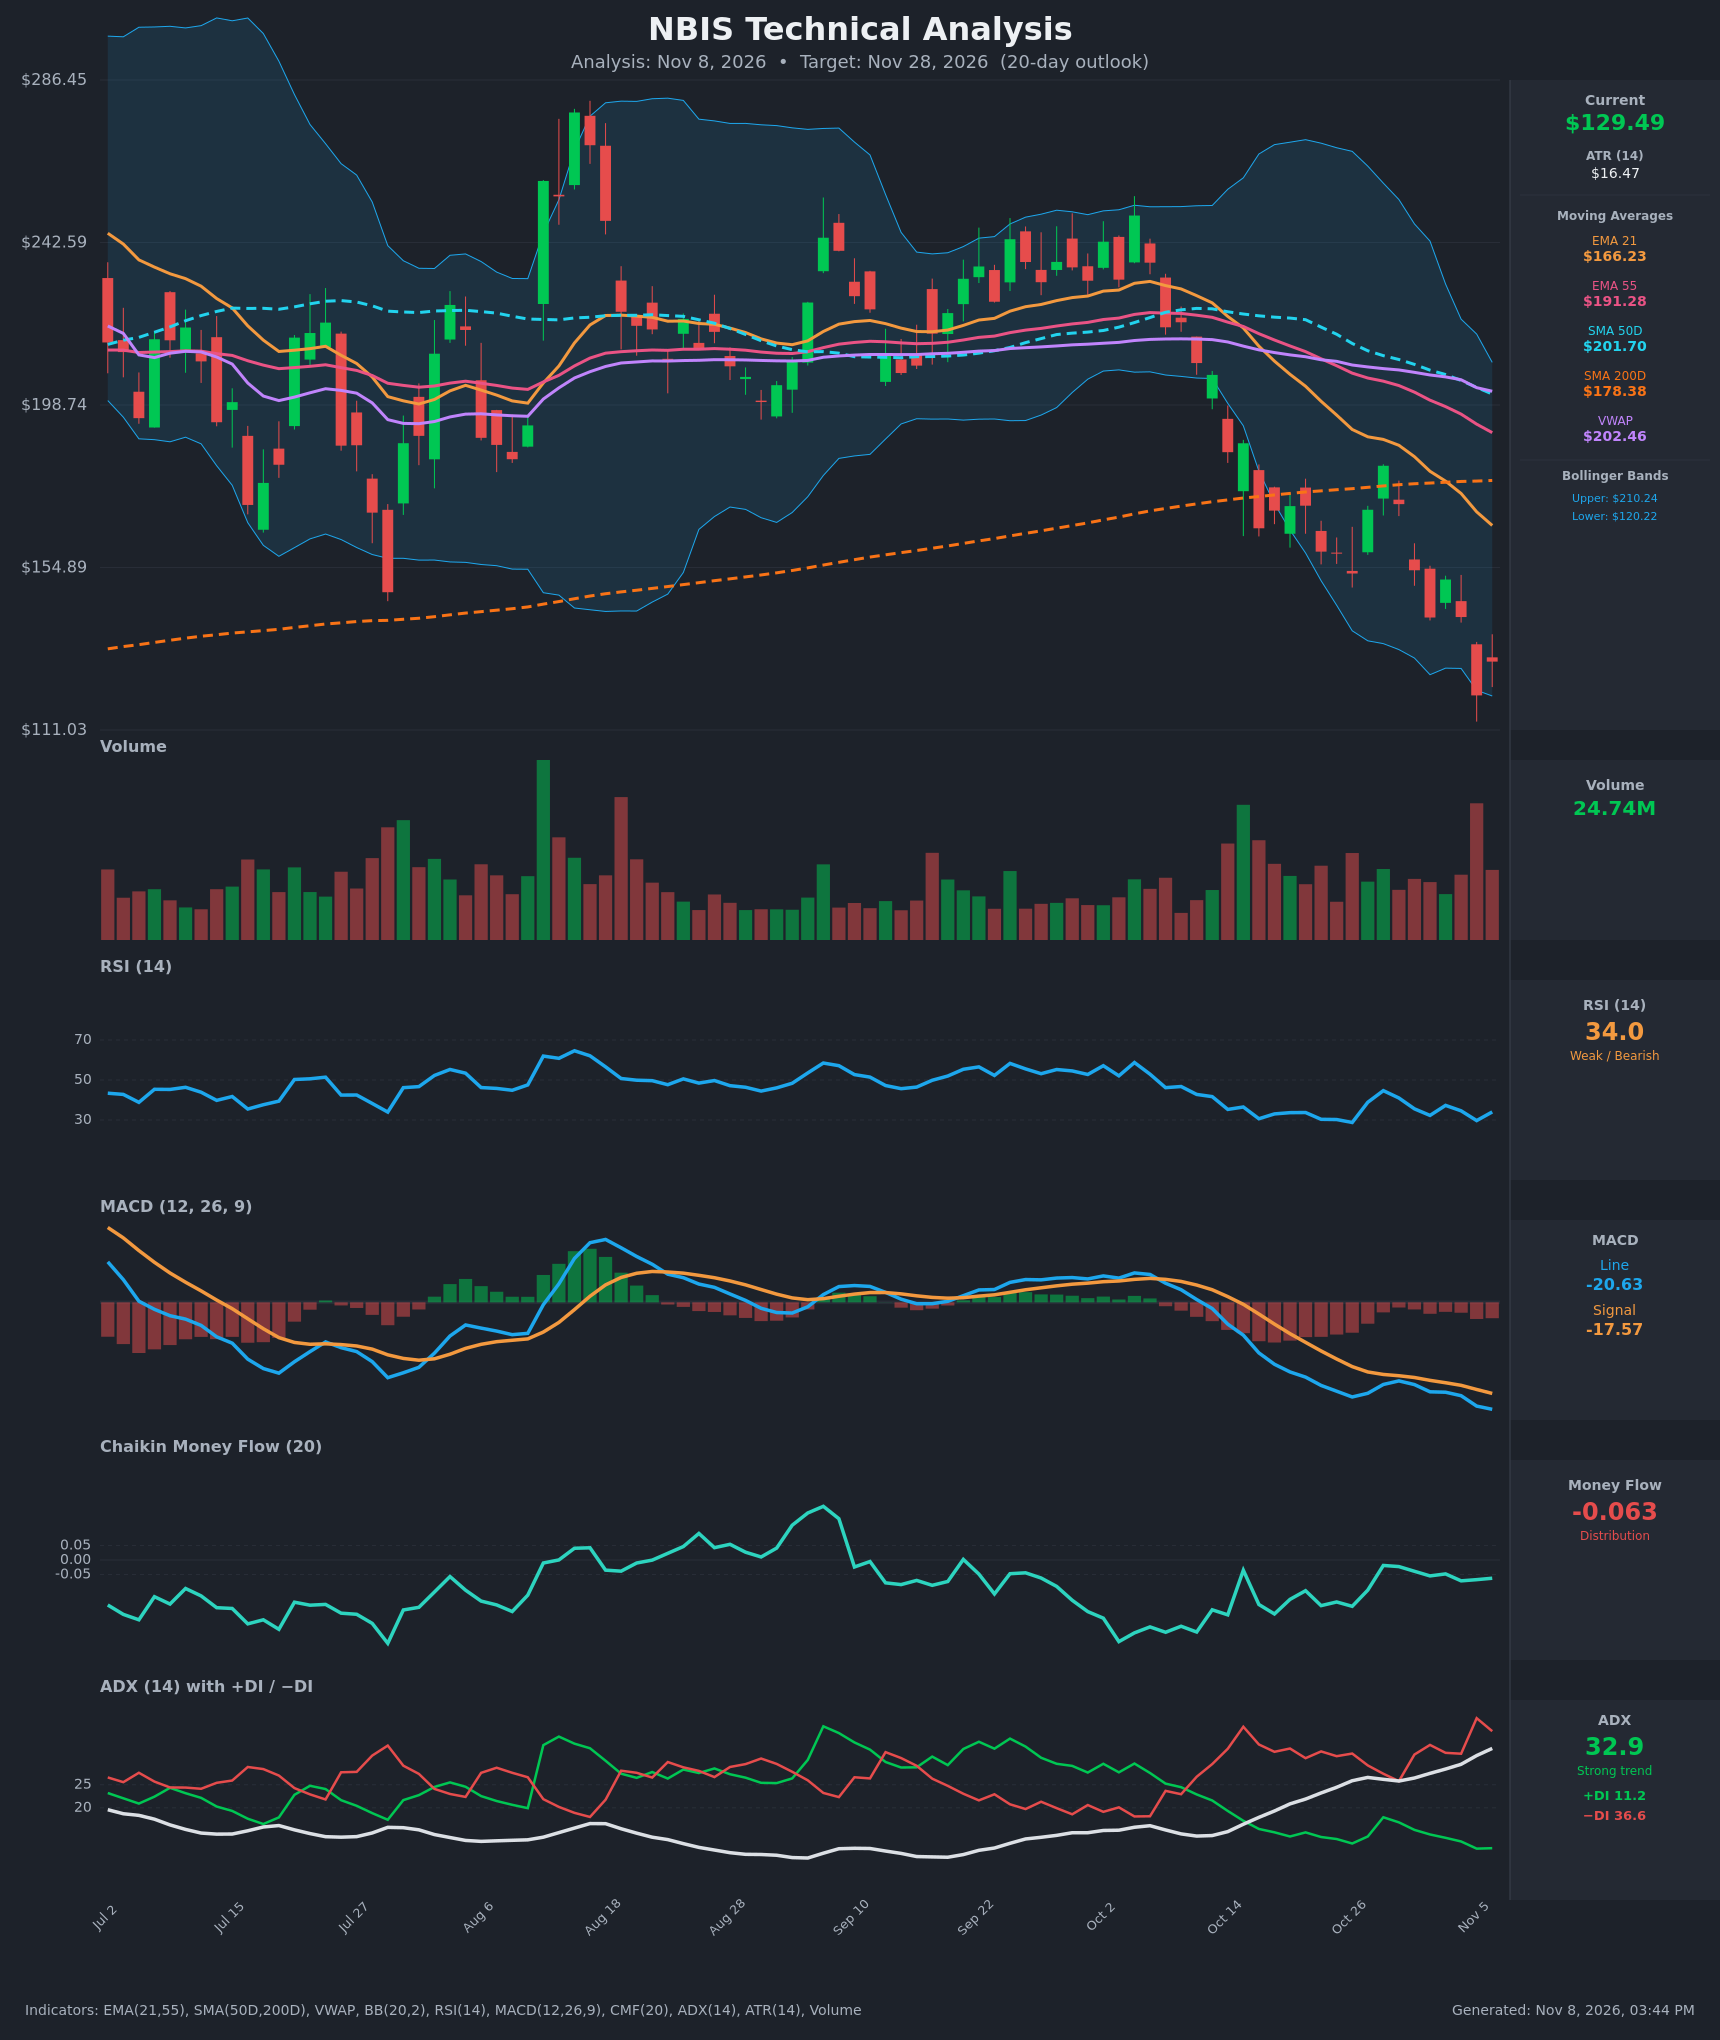
- RSI (14): 34.03, near but not in oversold territory. It has stayed in the 29-38 band for weeks and tagged 29.7 on Nov 5, so it is making no real push toward 50. A reading this low also leaves room for a relief bounce. [Bearish]
- 20 EMA: The data shows EMA 21 at $166.23, and price at $129.49 is about 22% below it. The EMA is falling steeply (from $210.58 on Oct 19), so it acts as dynamic resistance. EMA 21 is also below EMA 55 ($191.28), a bearish alignment. [Bearish]
- MACD: Line -20.63 is below signal -17.57, and the gap is widening (-3.06). Both lines are falling and the histogram is negative and expanding. The line made new lows on Nov 5-6 with no bullish crossover in sight. [Bearish]
- Bollinger Bands (20): Upper $210.24, lower $120.22. The bands are very wide, reflecting a volatility expansion. Price tagged the lower band on Nov 5 ($120.37) and bounced to $129.49, which is in the lower quarter of the band. Walking the lower band in a strong trend is bearish, though a snap-back toward the midline is possible. [Bearish]
- CMF (20): -0.063, just below the -0.05 threshold. It has been negative for the whole 15-bar window and is mildly improving from -0.186. Distribution persists, but selling pressure is fading. [Distribution]
- ADX (14): 32.9 and rising (up from 19.3 on Oct 19). −DI at 36.6 is far above +DI at 11.2. This is a strong, accelerating downtrend with bears firmly in control. [Strong Trend – Bearish]
- Volume: 24.74M, with heavy volume on the recent red candles, especially the Nov 5 breakdown. The selloff has conviction. High volume near the lows could also be partial capitulation, but there is no confirmed reversal volume yet. [Bearish / possible capitulation]
DIVERGENCES & TRENDS
- Price/RSI: There is no clear bullish divergence. RSI printed 28.8 on Oct 26 and 29.7 on Nov 5, roughly equal lows while price made a much lower low ($153 to $120). That is a mild hint of fading downside momentum, but it is not confirmed.
- Moving averages: Price is below EMA21, EMA55, SMA50D ($201.70), SMA200D ($178.38) and VWAP ($202.46). EMA21 has crossed below EMA55 and both are falling. SMA50D is converging on SMA200D (gap about $23 and narrowing), so a death cross could develop in coming weeks.
- Long-term trend: Losing the SMA200D (price is about 27% below it) is a major long-term breakdown.
- MACD: It stays below signal with no bullish cross. The widening gap confirms accelerating momentum to the downside.
- DI: −DI has been above +DI throughout the window, and the spread has widened to about 25 points.
- CMF: Its trend is flat-to-slightly-improving, a minor divergence against price making new lows.
CHART PATTERNS
- The dominant structure is a sharp downtrend of lower highs ($182 → $171 → $151) and lower lows ($153 → $141 → $120). It most resembles a bearish flag/pennant continuation setup from the reference diagram, with the small bounces as flags inside a falling channel. The measured move from the prior leg ($182 → $120, about $62) would imply further downside if the flag breaks lower.
- The Oct 19-Nov 6 sequence of lower highs does not match the Bullish Falling Wedge pattern cleanly. The wide-range, high-volume swings look more like an expanding structure, so no bullish reversal pattern is confirmed.
- Reversal-pattern watch: a Bullish Double Bottom near $120 would need a retest of $120 that holds and a close above $141-$152. That is not yet present.
POTENTIAL SCENARIOS
- Scenario 1: Bearish Trend Continuation — The strong ADX, −DI dominance, negative MACD and sub-SMA200D position suggest sellers resume control after a weak bounce. Trigger: a rejection near $135-$141, or a close below $120.37. Target: $112-$120, with $120.50 as the central estimate. Invalidation: a daily close above $141.40 with rising volume. (50% probability)
- Scenario 2: Bullish Oversold Relief Bounce — RSI is near 30, price is at the lower Bollinger Band, and CMF is improving. A mean-reversion rally toward the falling EMA21 is plausible. Trigger: a hold above $120 and a close above $141.39. Target: $150-$166, where the 21 EMA is overhead resistance. Invalidation: a fall back below $120.37. (30% probability)
- Scenario 3: Neutral Consolidation — Price stabilizes after the capitulation-style drop and chops between $118 and $140. Trigger: ADX flattening and a series of inside days. Target: $125-$135. Invalidation: a decisive break of either $118 or $141. (20% probability)
PRICE TARGETS
- Target Price: $120.50 (20-day outlook)
- Expected Range: $114.00 to $129.00 (width $15 ≈ 11.6% of the current price, consistent with the 14-21 day guidance)
- Key Levels: Support at $120.37, Resistance at $141.39
OVERALL BIAS
OVERALL BIAS: BEARISH - Price sits below all major moving averages, MACD is below signal and widening, ADX is above 30 and rising with −DI far above +DI, and CMF shows distribution. An oversold bounce is possible and keeps conviction modest, but the weight of the evidence favors further downside over 20 days.
This is educational analysis and not financial advice.