ORCL 20-day bearish forecast — Nov 8, 2026
- Bias: Bearish
- Timeframe: 20 days (made Nov 8, 2026, target date Nov 27, 2026)
- Price at analysis: $116.10
- Price target: $111.00
- Expected range: $104.50 – $118.00
- Result: Pending — graded after the close on Nov 27, 2026
Get a free AI analysis of ORCL today
Analysis
TECHNICAL INDICATORS
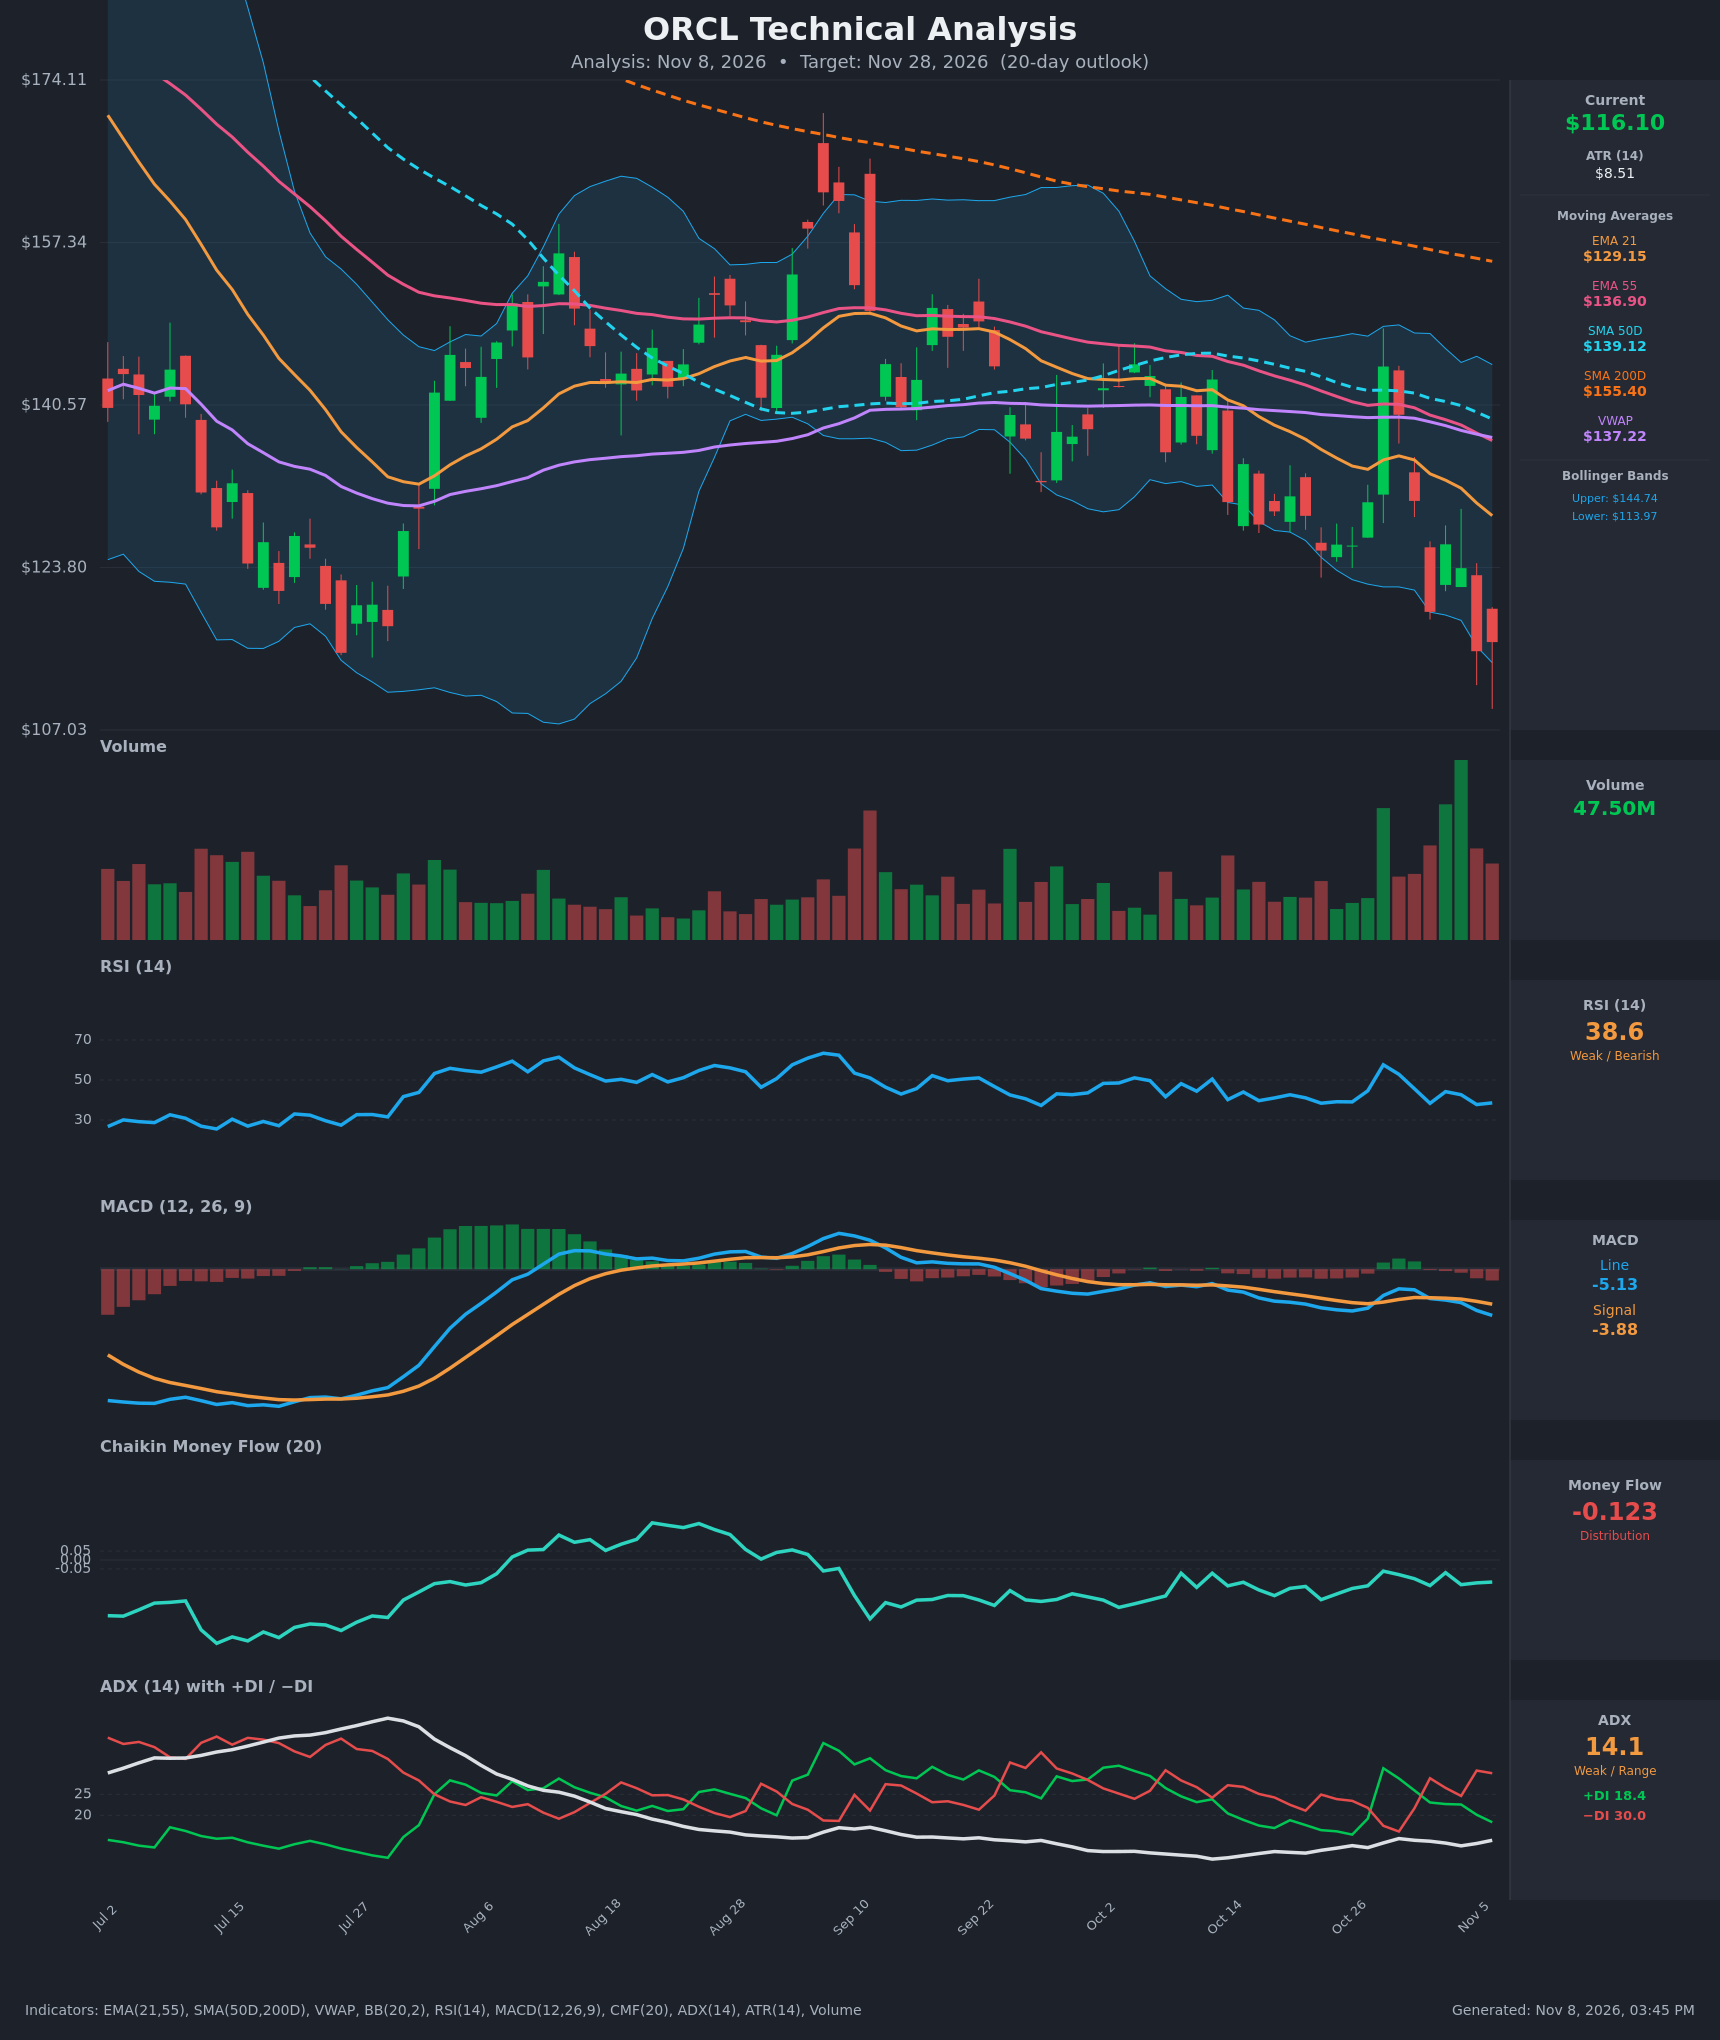
- RSI (14): 38.56, in the weak half of the range but not oversold (<30). It has made lower highs since the Oct 28 spike (57.6 → 38.6), and its recent lows (37.7 and 38.3) are shallow, so downside momentum has not yet been exhausted. [Bearish]
- 20 EMA: The closest EMA is the 21 EMA at $129.15, and price ($116.10) is about 10% below it. The 21 EMA is falling steadily (138.5 → 129.2 over 15 bars) and sits below the 55 EMA ($136.90), so it acts as overhead resistance. [Bearish]
- MACD: Line -5.129 is below signal -3.880, and the histogram is negative at about -1.25 and widening. The bullish blip on Oct 28-29 failed, and the line crossed back under the signal on Nov 2. Momentum is accelerating to the downside. [Bearish]
- Bollinger Bands (20): Upper $144.74, lower $113.97. Price at $116.10 sits in the bottom ~7% of the band, about $2 above the lower band. The bands are fairly wide, and price has been walking the lower half since late October. Wicks have pierced below the band, which could trigger a short-term mean-reversion bounce, but there is no squeeze or reversal signal. [Bearish]
- CMF (20): -0.123, below the -0.05 threshold and negative for the entire recent window (-0.06 to -0.22). This shows persistent distribution with no sign of accumulation. [Distribution]
- ADX (14): 14.1, which is weak and range-like, but −DI (30.0) is well above +DI (18.4). The spread is wide and widening again after the brief +DI surge on Oct 28. The downtrend is directionally clear even though trend strength is low. [Weak Trend, Bearish Direction]
- Volume: 47.50M, elevated relative to the recent average. The heaviest recent volume came on the Oct 28 spike and the subsequent reversal, then on the red candles into new lows. The spike to $144.54 was fully retraced on heavy volume, which suggests distribution into strength. [Bearish – selling pressure on breakdown]
Moving average and VWAP context: price is below the 21 EMA ($129.15), 55 EMA ($136.90), 50D SMA ($139.12), VWAP ($137.22) and 200D SMA ($155.40). The 50D SMA is well below the 200D SMA, so the death cross is already in place. The 21 EMA is below the 55 EMA, so the short-term structure is also bearish.
DIVERGENCES & TRENDS
- No bullish divergence: Price made a new low at $115.16 on Nov 5. RSI (37.7), MACD and CMF all confirm the low rather than diverge from it.
- Trend: Every moving average is stacked in bearish order (price < 21 EMA < 55 EMA < 50D SMA < 200D SMA) and all are sloping down. The 50D/200D death cross is in place.
- Failed rally: The Oct 28 gap-up to $144.54 (+$14) reversed fully within 6 sessions, rejected at the upper Bollinger band and the 50D SMA zone. This is a classic bull trap.
- MACD: The bearish re-cross on Nov 2 and the widening gap are fresh signals. The histogram is expanding negative.
- DI: −DI re-crossed above +DI on Oct 30 and the spread is widening. ADX is low (14), so this is a grinding downtrend rather than a panic.
- Risk to the bearish view: Price is stretched about 10% below the 21 EMA and is hugging the lower Bollinger band, so a relief bounce of $6-10 is plausible at any time.
CHART PATTERNS
- The chart shows a sustained downtrend of lower highs and lower lows (peak ~$165 in early Sep → $144 on Oct 28 → $115 now). This is closest to a Bearish Flag/Descending Channel continuation on the reference diagram. The Oct 28 spike was a failed breakout out of the range.
- There is no confirmed reversal pattern. A Bullish Falling Wedge is only a speculative alternative if price stabilizes and the downtrend lines converge. Current lows are accelerating rather than contracting.
- Measured target: The recent decline from the $130 consolidation to $115 is about $15. Projecting that from a breakdown below $115 points to roughly $105-108. The $107 wick low (the chart's bottom axis) is the next major support.
POTENTIAL SCENARIOS
- Scenario 1: Bearish Downtrend Continuation — Sellers remain in control (−DI 30, CMF -0.12, MACD widening). Price breaks below $115.16 and drifts toward the $107-110 zone with lower highs capped by the falling 21 EMA. Trigger: daily close below $115 / lower Bollinger band ($113.97). Target: $108-$111. Invalidation: daily close above $124 with CMF turning positive. (50% probability)
- Scenario 2: Bullish Oversold Relief Bounce — Price stretches below the lower Bollinger band, and a snap-back toward the mean of the recent range is likely at some point. Trigger: reclaim of $120 on rising volume with an RSI turn above 45. Target: $124-$129 (prior consolidation and 21 EMA). Invalidation: close below $112. (33% probability)
- Scenario 3: Neutral Basing Range — Price stabilizes between $108 and $124 as the ADX stays below 20 and sellers pause. Trigger: several sessions of narrow-range candles holding $112-$120. Target: $114-$120. Invalidation: a decisive close outside $108-$124. (17% probability)
PRICE TARGETS
- Target Price: $111.00 (20-day, Nov 28, 2026)
- Expected Range: $104.50 to $118.00 (width $13.50 ≈ 11.6% of current price, consistent with the ~8-12% guideline for 14-21 days)
- Key Levels: Support at $108.00, Resistance at $123.80
Self-check: the range width is about 11.6%, which is appropriate for a 20-day horizon. It is wider than a 2-3 day range (~2-4%) and comparable with a 14-21 day range, and the target is below the current price, consistent with the bearish bias.
OVERALL BIAS
OVERALL BIAS: BEARISH - Price is below every key moving average with a death cross in place, −DI dominates +DI, MACD is widening negative, and CMF shows persistent distribution. A relief bounce is possible given the proximity to the lower Bollinger band, but the weight of evidence favors continuation toward the $108-$111 area.
This is educational analysis and not financial advice.