NVDA 20-day bearish forecast — Nov 8, 2026
- Bias: Bearish
- Timeframe: 20 days (made Nov 8, 2026, target date Nov 27, 2026)
- Price at analysis: $186.64
- Price target: $181.50
- Expected range: $172.00 – $193.00
- Result: Pending — graded after the close on Nov 27, 2026
Get a free AI analysis of NVDA today
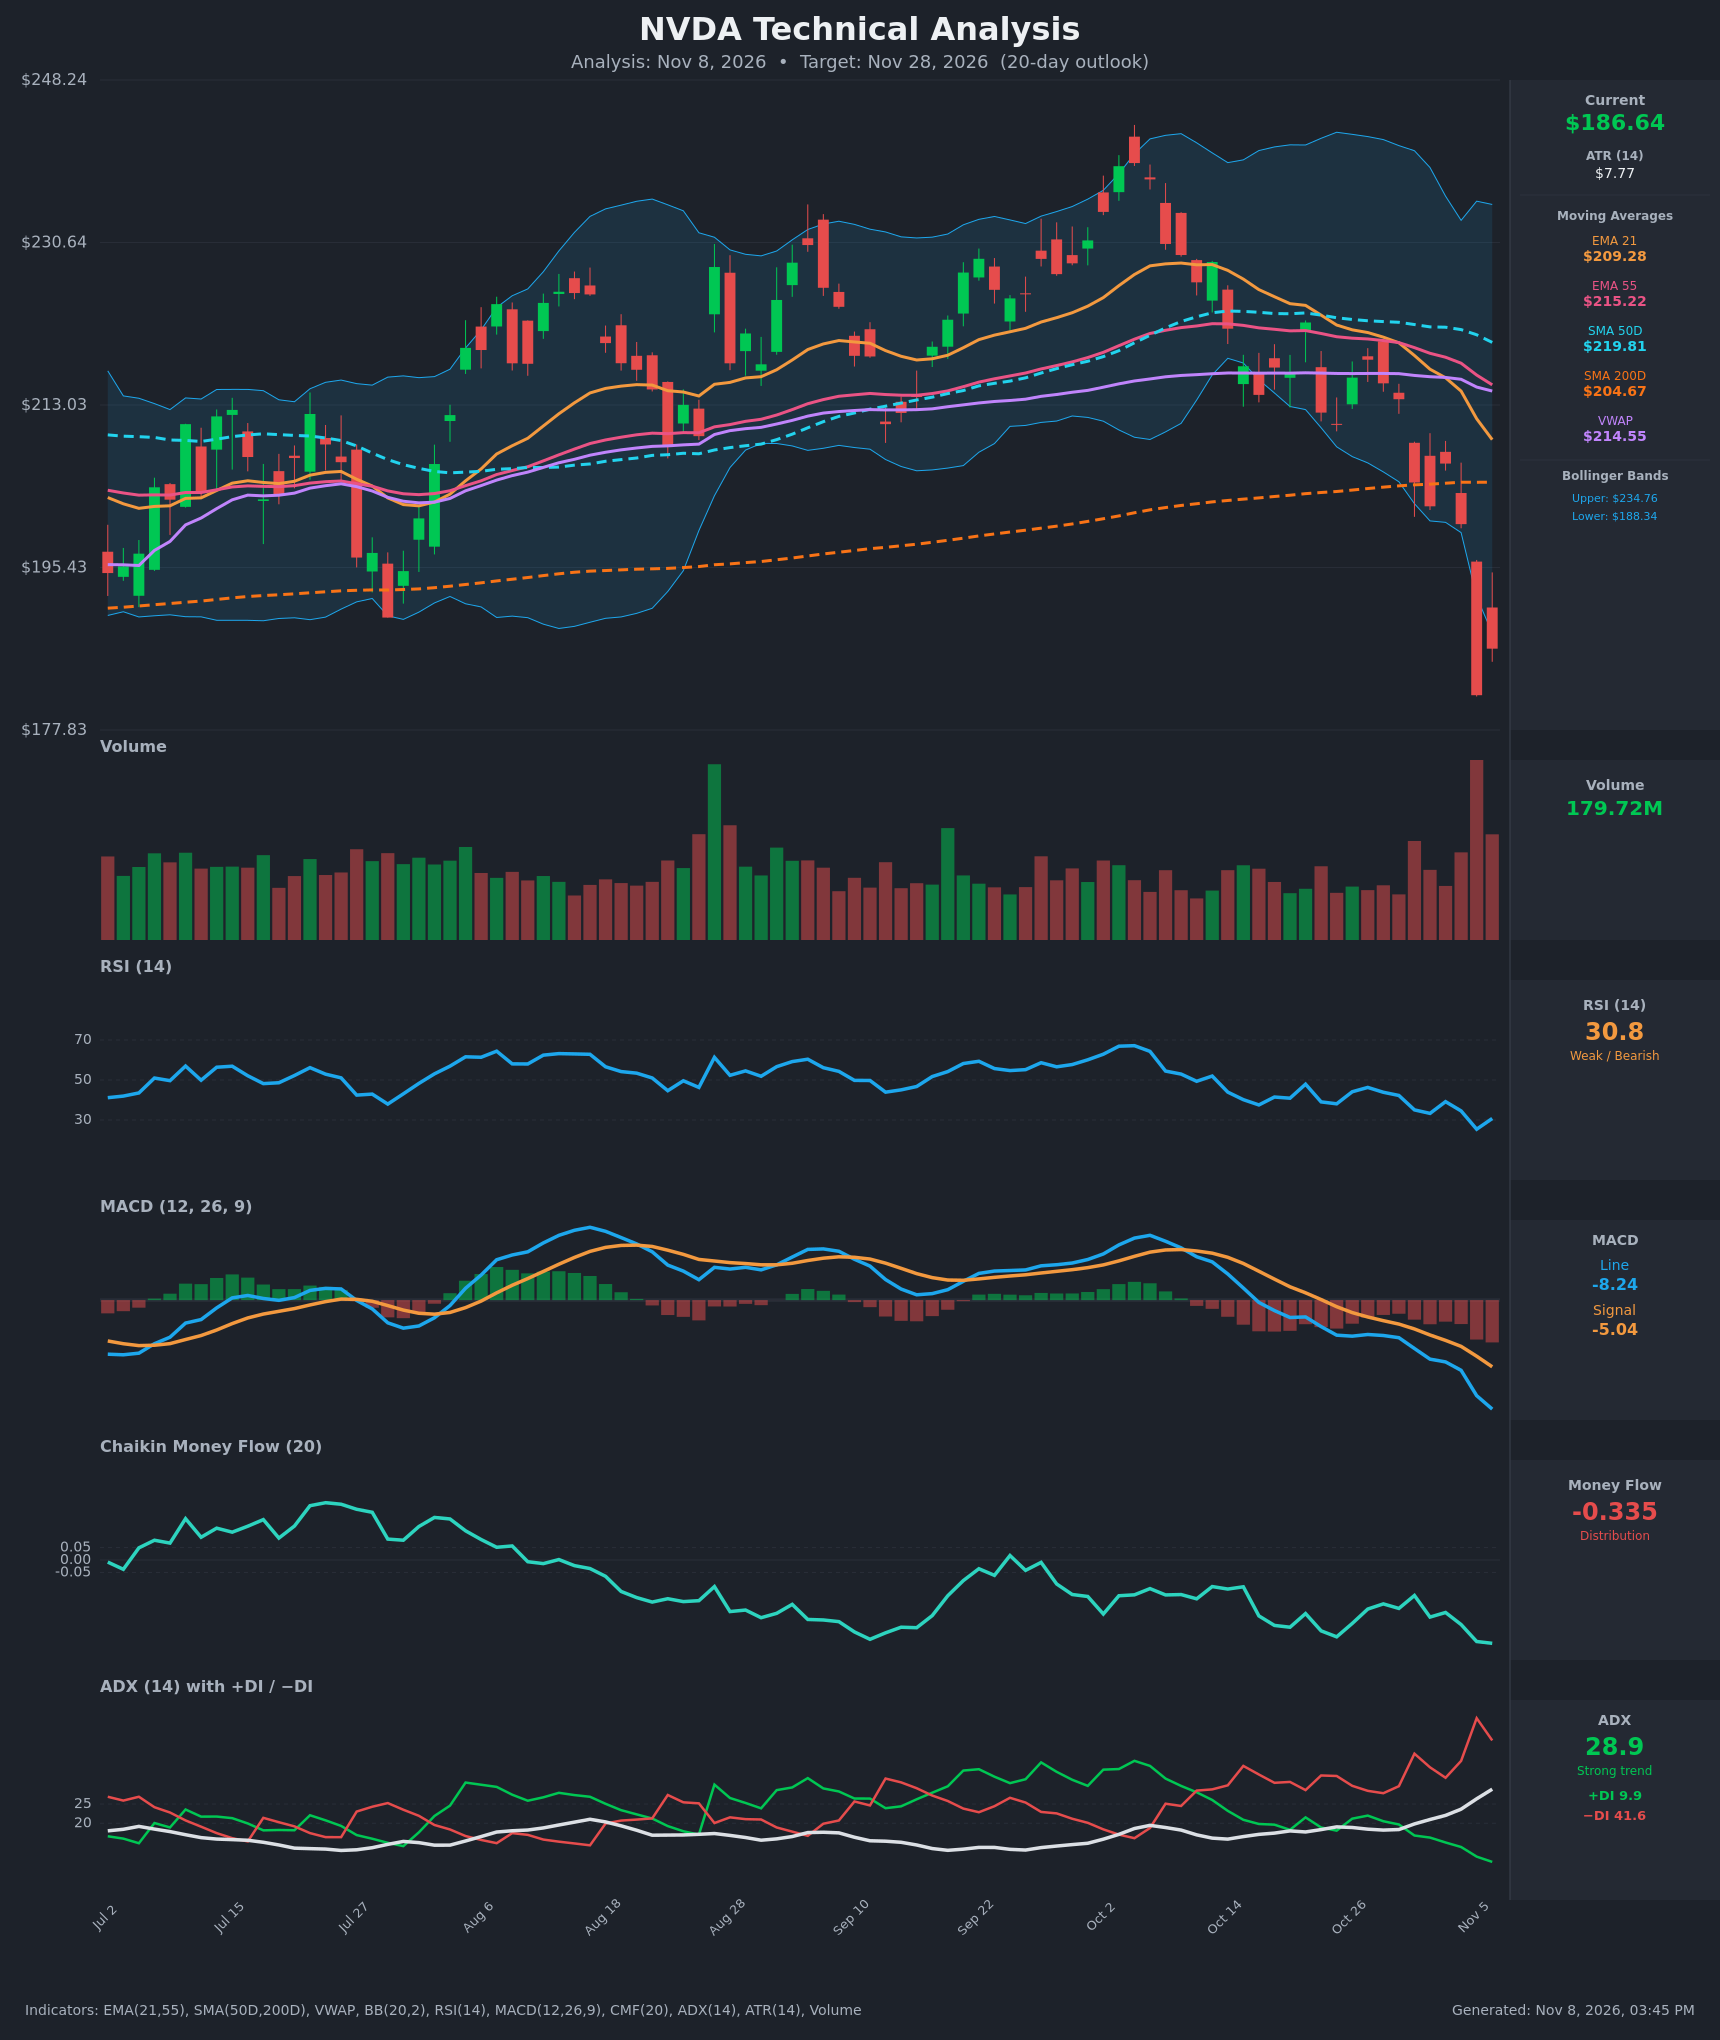
Analysis
TECHNICAL INDICATORS
- RSI (14): 30.76, bouncing off 25.4 on Nov 5, which was deeply oversold. It is still at the edge of oversold and well below 50, so momentum is weak. A relief bounce is possible, but there is no bullish RSI structure yet. [Bearish]
- 20 EMA (EMA 21): $209.28, with price about 10.8% below it. The EMA is falling steeply (from $224.76 on Oct 19) and acts as overhead resistance. EMA21 also crossed below EMA55 ($215.22) around Oct 29, a bearish crossover. [Bearish]
- MACD: Line -8.24 is below Signal -5.04, a bearish crossover that happened around Oct 23. The gap is widening (histogram about -3.2 and falling), and the line is accelerating lower. [Bearish]
- Bollinger Bands (20): Bands are $188.34 to $234.76. Price at $186.64 is below the lower band after a volatility expansion and a sharp band-walk down. This is stretched and can trigger a bounce, but in a strong trend a close below the lower band often signals continuation. [Bearish]
- CMF (20): -0.335, well below -0.05 and the lowest in the recent series (it was -0.14 on Oct 30). Sustained, worsening distribution. [Distribution]
- ADX (14): 28.9 and rising (17.4 on Oct 19), with −DI 41.6 far above +DI 9.9. This is a strong downtrend with sellers firmly in control. +DI is near its low for the period. [Strong Trend – Bearish]
- Volume: 179.72M, among the highest bars on the chart. The Nov 5 breakdown candle came on the heaviest volume of the period. That is heavy selling, with possible capitulation characteristics. It confirms the breakdown, but a stabilizing reversal would need follow-through. [Bearish – high-volume distribution]
Other trend context:
- Price is below the SMA200D ($204.67), the SMA50D ($219.81), VWAP ($214.55), and both EMAs. This is a full bearish stack.
- The SMA50D is still above the SMA200D, so there is no death cross yet. The gap has narrowed to about $15 and is closing.
DIVERGENCES & TRENDS
- No bullish divergence yet: Price made a new low at $181.60, and RSI (25.4) and MACD both made lower lows with it. Indicators confirm the price weakness.
- Momentum: The MACD line fell from -0.79 to -8.24 in 15 bars, and the histogram is widening negative. Momentum is accelerating down, not fading.
- Trend strength: ADX rose from 17 to 29 with −DI dominant, so a trend is emerging out of a prior range.
- Money flow: CMF has moved from the neutral/slightly negative zone to -0.335, confirming distribution.
- Key breaks:
- EMA21 crossed below EMA55 (about Oct 29).
- MACD crossed below its signal (about Oct 23).
- Price broke below the SMA200D (about Oct 30–Nov 5), a major support loss.
- Price closed below the lower Bollinger Band.
- Counter-signal: The long lower wick and Nov 6 bounce (+2.8%) with RSI recovering from 25 hint at an oversold relief rally. This is a tactical risk to the bearish view.
CHART PATTERNS
- Broad top and breakdown: Price peaked near $240 in early October, then rolled over in a series of lower highs, consistent with a distribution/reversal top. The loss of the SMA200D resembles a Bearish Head and Shoulders / Double Top neckline breakdown, although it is not a textbook match.
- Bearish Flag/Pennant-style continuation: The tight consolidation around $210–$220 from mid-to-late October ended in a sharp downside break. This resembles the Bearish Pennant/Flag continuation. The measured move from the flagpole implies further downside.
- Targets: The initial gap is $181.60 (Nov 5 close/low area), then the ~$177.83 chart low. A break below that opens the room toward the mid-$170s. The upside is capped by the $200–$205 zone (SMA200D, now resistance).
POTENTIAL SCENARIOS
- Scenario 1: Bearish Trend Continuation — The strong downtrend (ADX 29, −DI 41.6, CMF -0.335) persists, and any bounce fades below the EMA21/SMA200D. Price retests and probes below the Nov 5 low. Trigger: failure to hold $186–$188 or a daily close below $181.60. Target: $177–$182, with an extension to about $172. Invalidation: daily close above $200 (reclaiming the Nov 4 close and approaching the SMA200D). (50% probability)
- Scenario 2: Bullish Oversold Relief Rally — Capitulation-style volume and RSI at 25 trigger a mean-reversion bounce toward the declining EMA21 and the SMA200D. Trigger: a close above $192 with RSI above 40 and a MACD histogram that stops falling. Target: $195–$205 (the gap fill), where sellers should re-emerge. Invalidation: a close below $181.60 that negates the bounce. (33% probability)
- Scenario 3: Neutral Basing Range — Price stabilizes after the shock and chops between the Nov 5 low and lower-band resistance for most of the period. Trigger: low-volume, narrow-range candles with ADX flattening. Target: $182–$194. Invalidation: a break outside this range on volume. (17% probability)
PRICE TARGETS
- Target Price: $181.50 (20-day, about 2.8% below current)
- Expected Range: $172.00 to $193.00 (width $21.00, about 11.3% of current price, consistent with the 14–21 day guidance)
- Key Levels: Support at $181.60 (Nov 5 close/low zone, with the chart low near $177.83 below it), Resistance at $200.13 (Nov 4 close, just below the $204.67 SMA200D)
OVERALL BIAS
OVERALL BIAS: BEARISH – Price broke below the SMA200D and the lower Bollinger Band on heavy volume. ADX is rising with −DI dominant, MACD is accelerating lower, CMF shows heavy distribution, and all major moving averages are overhead. The oversold RSI makes a relief bounce likely along the way, but the dominant evidence favors continued weakness over the 20 days.
This is educational analysis and not financial advice.