PLTR 20-day bearish forecast — Nov 8, 2026
- Bias: Bearish
- Timeframe: 20 days (made Nov 8, 2026, target date Nov 27, 2026)
- Price at analysis: $160.38
- Price target: $153.50
- Expected range: $145.00 – $163.50
- Result: Pending — graded after the close on Nov 27, 2026
Get a free AI analysis of PLTR today
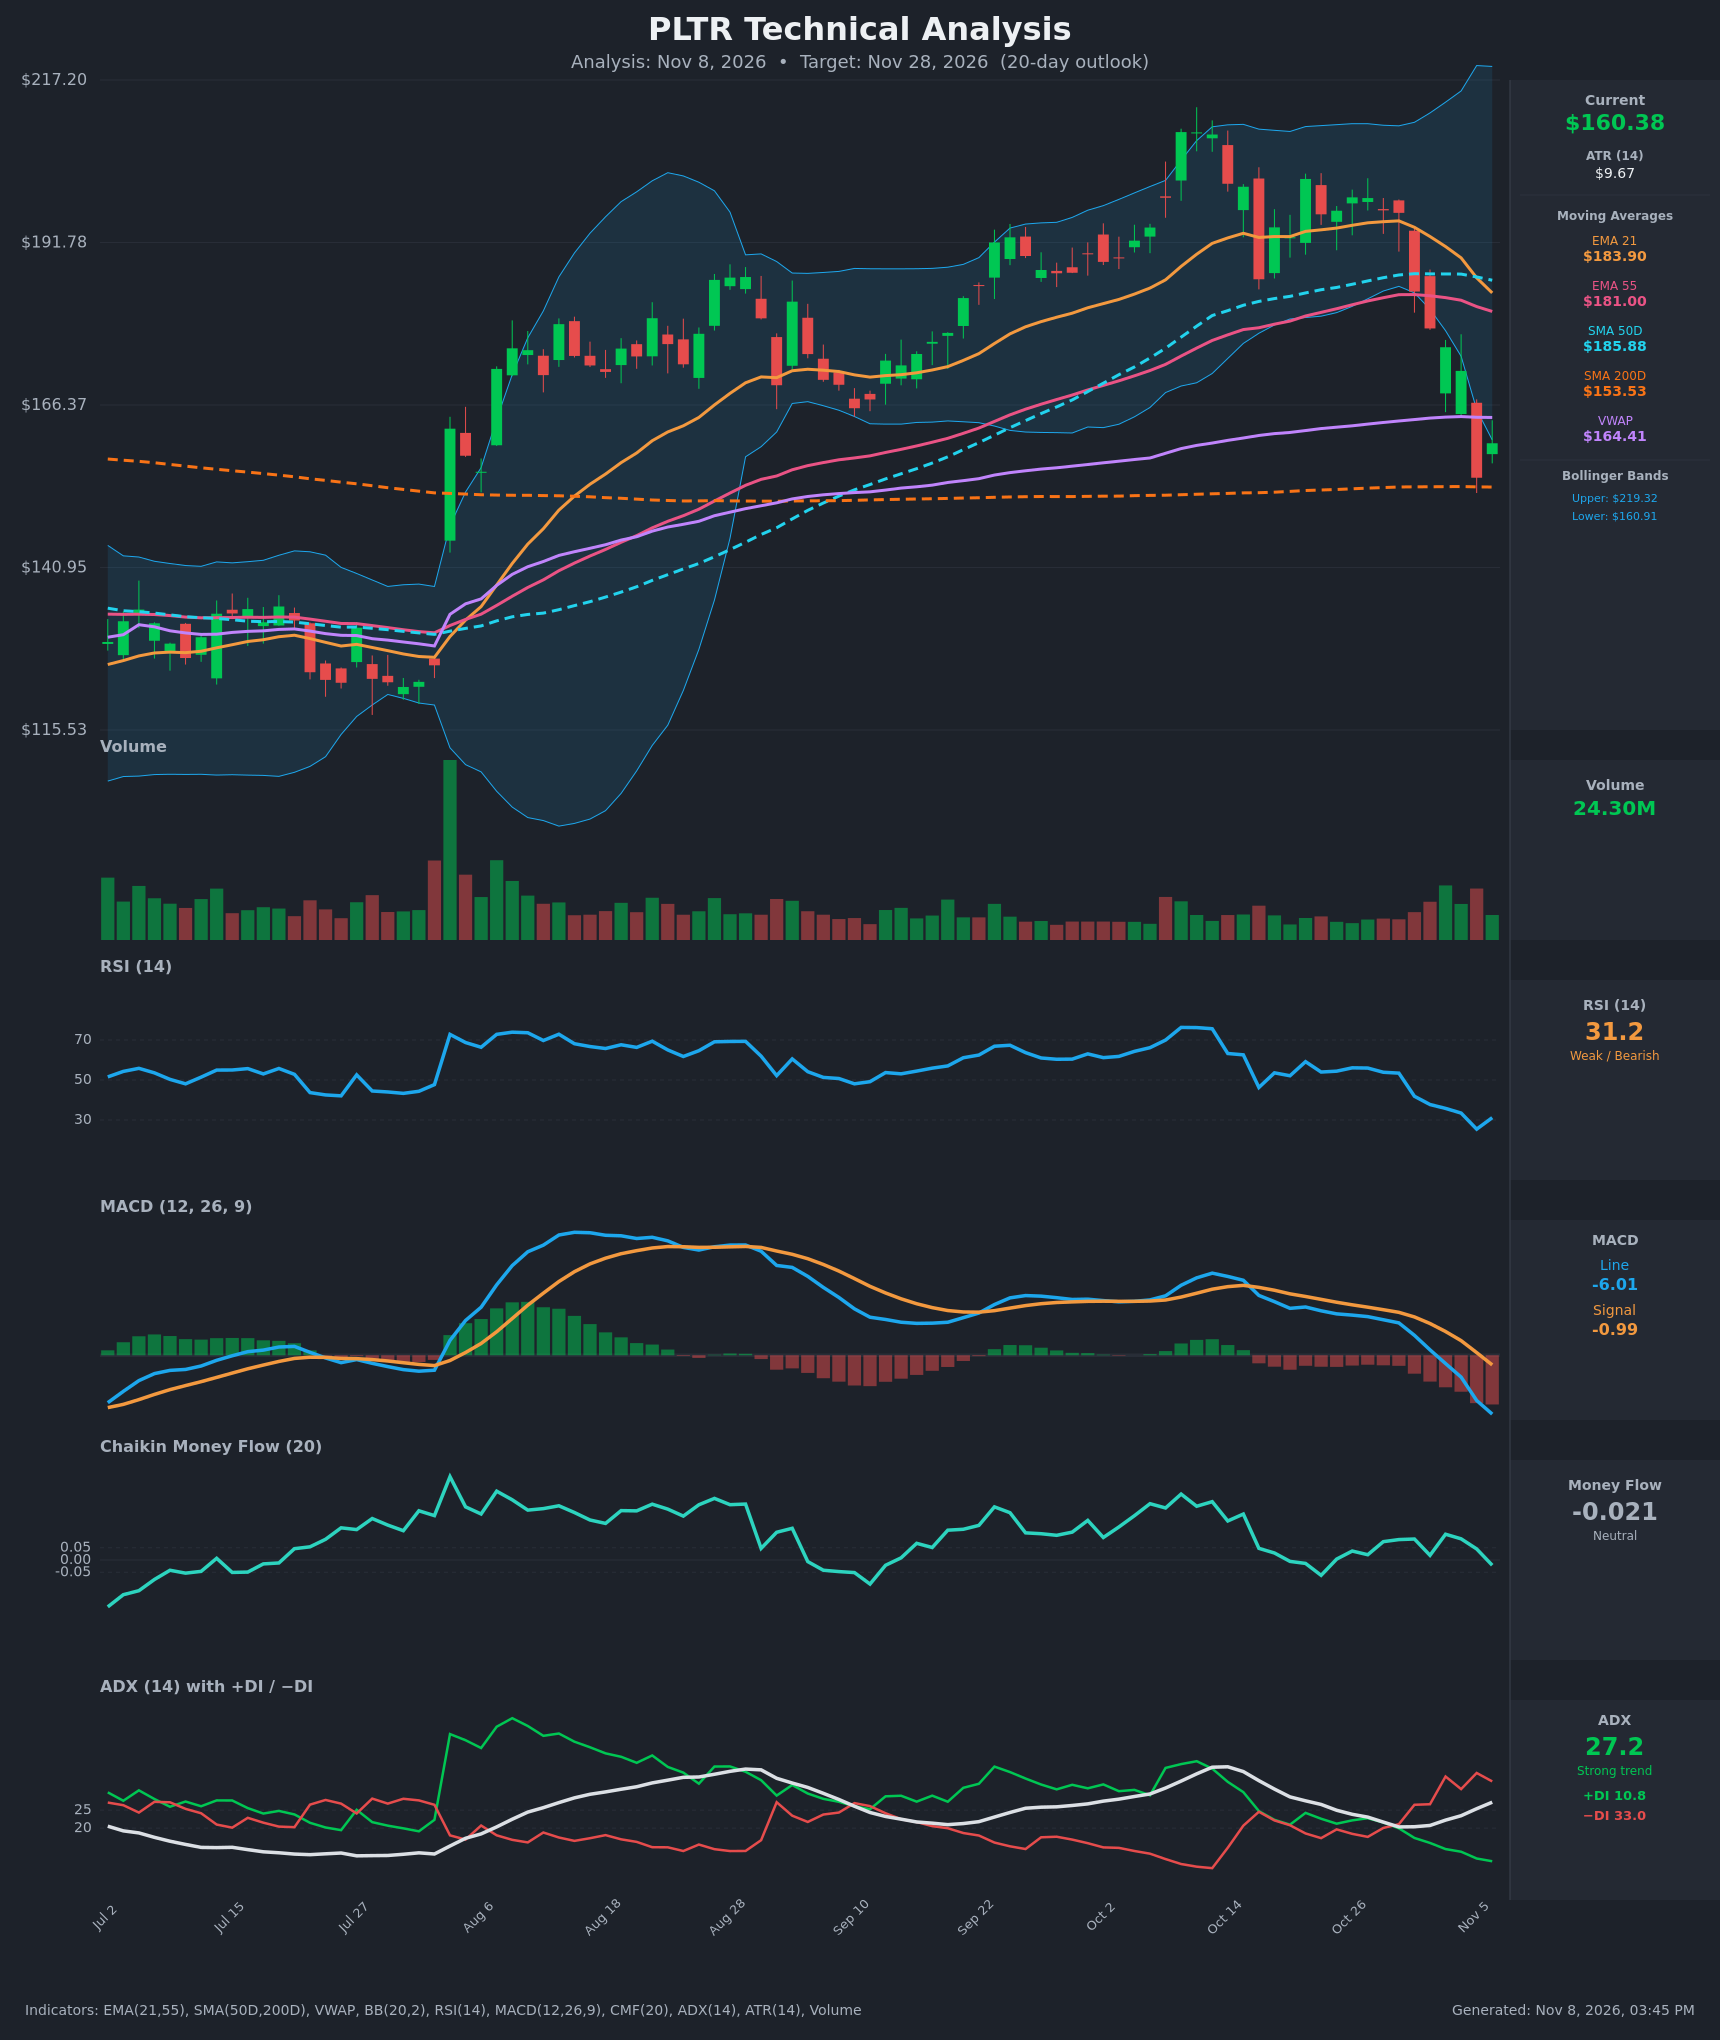
Analysis
TECHNICAL INDICATORS
- RSI (14): 31.17, bouncing off 25.4 (Nov 5) but still just above oversold and well below 50. The slide from 53 to 25 in about 7 sessions shows a sharp momentum collapse. The bounce is early and unconfirmed. [Bearish]
- 20 EMA: The chart shows EMA 21 at $183.90, well above the $160.38 price (about 12.8% overhead). EMA 21 is rolling over fast and is about to cross below EMA 55 ($181.00), which would be a bearish crossover. It acts as heavy resistance. [Bearish]
- MACD: Line -6.01 is below Signal -0.99, a bearish crossover that occurred on Nov 3. The histogram is deeply negative and still expanding, so downside momentum has not yet peaked. [Bearish]
- Bollinger Bands (20): Price is $160.38, at the lower band ($160.91) after a sharp break from the mid-band. The upper band ($219.32) is far away, so volatility is elevated. A walk down the lower band is possible in a strong trend, but a lower-band tag after a 20% drop also invites a relief bounce toward the mid-band. [Neutral]
- CMF (20): -0.021, inside the neutral band (±0.05) after being positive through late October. Money flow has faded, but there is no heavy distribution reading yet. [Neutral]
- ADX (14): 27.2 and rising, with -DI (33.0) far above +DI (10.8). The -DI/+DI crossover happened Oct 30, and the spread has widened since. This is a strong, established downtrend. [Strong Trend – Bearish]
- Volume: 24.30M on the latest bar, lighter than the heavy-volume selloff candle on Nov 5. Selling was decisive, while the bounce came on modest volume and lacks buyer conviction. [Bearish bias, tentative stabilization]
DIVERGENCES & TRENDS
- No bullish divergence yet: RSI made a fresh low at 25.4 alongside price at $154.99. The bounce to 31 has no confirming momentum thrust.
- MACD: The bearish cross (Nov 3) is widening, and the histogram is at its most negative reading in the visible window.
- Moving averages: Price is below EMA21, EMA55, SMA50D, and VWAP ($164.41). It remains above SMA200D ($153.53), the key long-term support. EMA21 is converging on EMA55 for a bearish cross. SMA50D ($185.88) is still above SMA200D, so there is no death cross, but the gap is narrowing.
- DI: Bears have been in control since Oct 30, and ADX has risen from 20 to 27. This is the trend strengthening, not fading.
- Candle structure: The Nov 5 candle had a long lower wick that tested the SMA200 area, followed by a small green candle. This is a potential, but unconfirmed, bounce signal.
CHART PATTERNS
- Bearish Double Top / rounded top (reversal): Price topped near $200–205 in mid-to-late October with two failed pushes. It then broke down through the $185 support zone, which sits near SMA50D and the EMA cluster. The measured move (peak ~$205 minus neckline ~$185 = ~$20) points to roughly $165. Price has already reached and slightly exceeded that, so the pattern is largely fulfilled, which raises the odds of a relief bounce.
- Breakdown from a consolidation range: The $185–200 range has failed. Former support in that zone is now resistance.
- Next structural support: SMA200D at $153.53, then the August breakout gap area around $140–148. A break below the SMA200 would open that zone.
POTENTIAL SCENARIOS
- Scenario 1: Bearish Trend Continuation to SMA200 — The strong -DI dominance, MACD acceleration, and EMA21/55 cross keep sellers in control. Any bounce stalls at VWAP/lower-band resistance, and price drifts to test the 200-day SMA, possibly undercutting it. Trigger: rejection at $164–166 or a daily close below $154.99. Target: $153.50, with an extension to $145. Invalidation: daily close above $172. (50% probability)
- Scenario 2: Bullish Oversold Relief Bounce — RSI is near 30, price is at the lower Bollinger Band and the 200-day SMA, and the measured move is complete. A snap-back rally retraces toward the declining EMAs. Trigger: close above VWAP $164.41 with rising volume and RSI above 40. Target: $172–176, with the EMA21 at ~$184 as the ceiling. Invalidation: close below $153.50. (35% probability)
- Scenario 3: Neutral Basing Range — Price consolidates between the SMA200 and VWAP as the selloff exhausts. Trigger: several days of inside-range closes with ADX turning down. Target: $155–165. Invalidation: break of either boundary. (15% probability)
PRICE TARGETS
- Target Price: $153.50 (20-day outlook, Nov 28, 2026)
- Expected Range: $145.00 to $163.50 (width $18.50, about 11.5% of the current price, consistent with the 14–21 day guideline)
- Key Levels: Support at $153.53 (SMA200D), Resistance at $164.41 (VWAP)
OVERALL BIAS
OVERALL BIAS: BEARISH - A strong, rising ADX with -DI far above +DI, a widening MACD bearish cross, and price below all the short-term moving averages favor a test of the 200-day SMA near $153.50. Conviction is modest because RSI is near oversold and the measured move of the topping pattern is already complete, so a relief bounce is a real risk.
This is educational analysis and not financial advice.