RKLB 20-day bearish forecast — Nov 8, 2026
- Bias: Bearish
- Timeframe: 20 days (made Nov 8, 2026, target date Nov 27, 2026)
- Price at analysis: $53.07
- Price target: $51.00
- Expected range: $46.00 – $59.50
- Result: Pending — graded after the close on Nov 27, 2026
Get a free AI analysis of RKLB today
Analysis
TECHNICAL INDICATORS
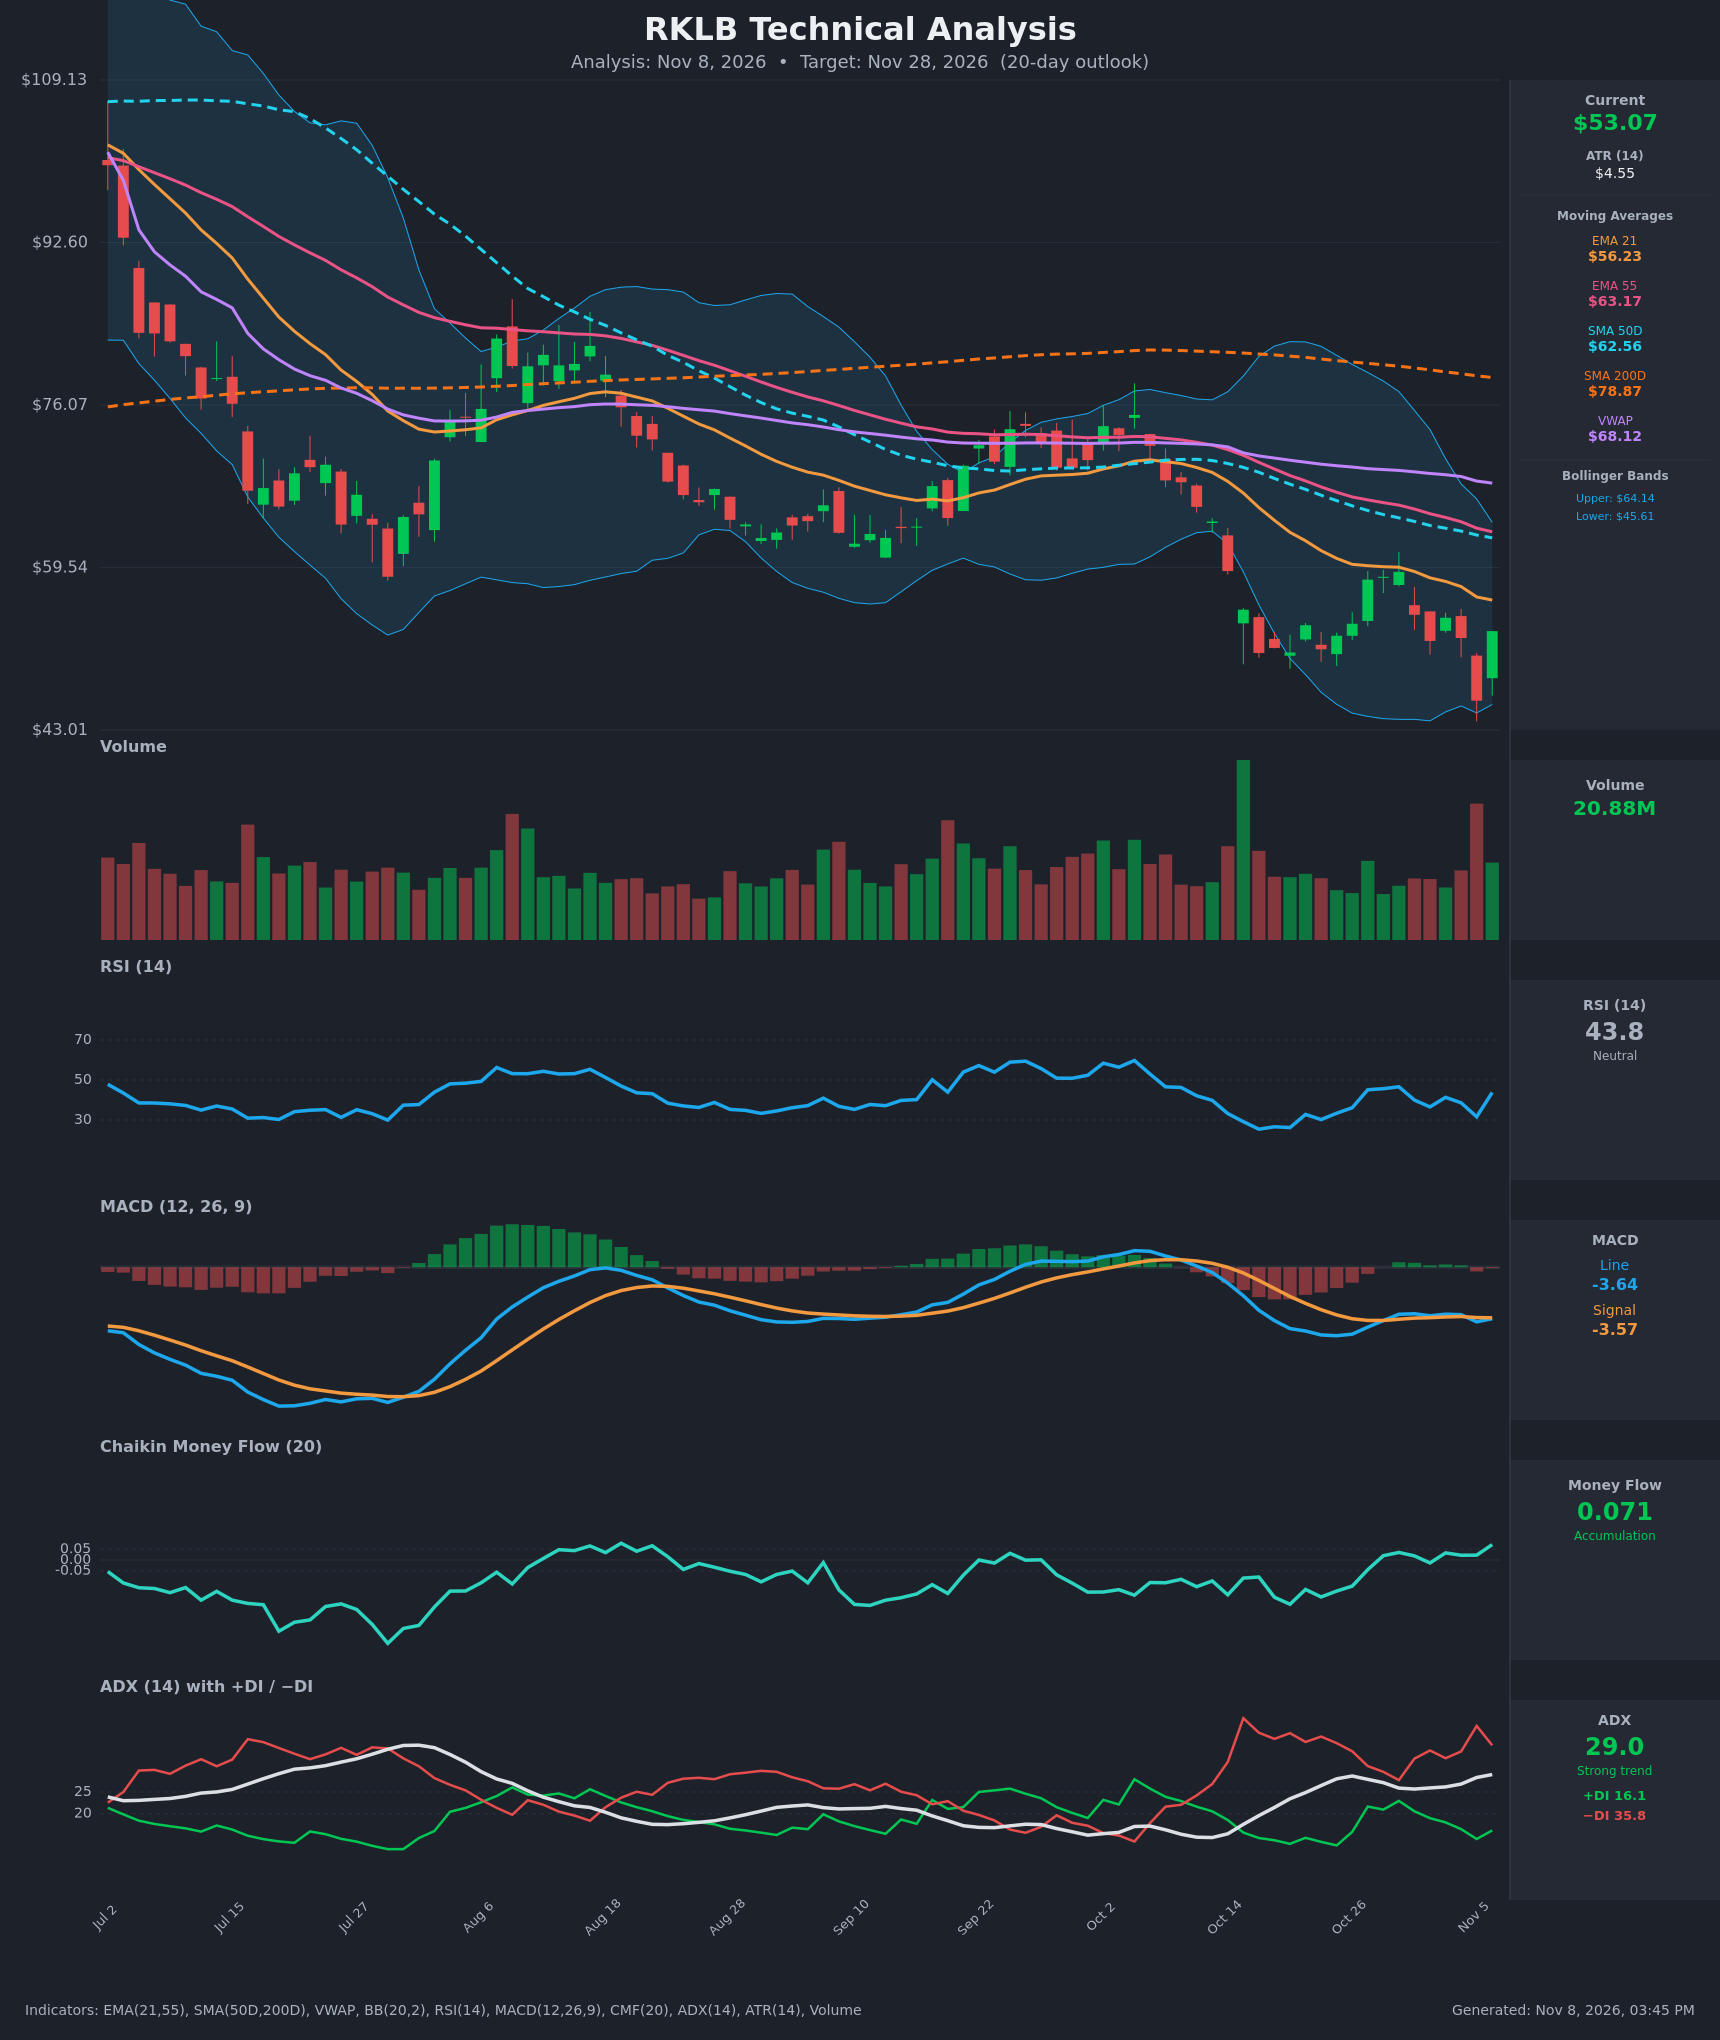
- RSI (14): 43.78. It bounced from 31.6 yesterday and 26 in mid-October, but it is still below 50 and has not recovered the 45–47 zone where rallies stalled on Oct 27–29. Momentum is recovering from oversold but remains sub-50. [Neutral]
- 20 EMA (EMA 21): $56.23, with price at $53.07 below it. EMA 21 is falling steadily (64.34 → 56.23 in 15 bars), and it sits above price as dynamic resistance. EMA 55 at $63.17 and SMA 50D at $62.56 are well overhead. [Bearish]
- MACD: Line -3.64 vs signal -3.57. The line is marginally below the signal, with a slightly negative histogram (~-0.07). Both lines are deeply negative and flat, and the line crossed back below the signal on Nov 2 after a brief positive spell. Momentum is stalled and tilted bearish. [Bearish]
- Bollinger Bands (20): Upper $64.14, lower $45.61, with the midline around $54.9. Price ($53.07) is just below the midline. Wide bands signal elevated volatility. Yesterday's low close of $45.99 tagged the lower band and reversed sharply. Price is now in the lower half of the bands. [Neutral]
- CMF (20): +0.071, above the +0.05 threshold. It has turned positive over the last 8 sessions after being -0.17 to -0.20 in mid-October. There is some buying on dips, which is an early sign of accumulation, but it is a shallow reading. [Accumulation]
- ADX (14): 29.0, rising, with -DI 35.8 well above +DI 16.1. This is a strong, established downtrend, and bears remain firmly in control despite the bounce. [Strong Trend – Bearish]
- Volume: 20.88M on the green rebound candle. Volume spiked on the Nov 5 breakdown candle (the largest recent bar) and again on the rebound, which suggests a capitulation-style flush with an attempt to bounce. Not yet confirmed follow-through. [Mixed – possible capitulation]
DIVERGENCES & TRENDS
- Moving average structure: Price is below EMA 21 ($56.23), EMA 55 ($63.17), SMA 50D ($62.56), SMA 200D ($78.87) and VWAP ($68.12). EMA 21 is below EMA 55 and SMA 50D is below SMA 200D (death cross already in place). This is a fully bearish stack.
- RSI vs price: Price made a lower low on Nov 5 ($45.99), while RSI printed 31.6, higher than the 26 low in October. This is a mild bullish RSI divergence, but it is not confirmed.
- CMF vs price: CMF has been rising since mid-October while price made lower lows, a bullish divergence that suggests selling pressure is waning.
- MACD: Both lines are negative and flat with no bullish crossover. Momentum has stabilized but not turned.
- ADX/DI: -DI has been above +DI throughout, and the Nov 6 bounce did little to change that. A trend-following bearish structure is intact.
- Price action: A series of lower highs (~$59 on Oct 29 versus ~$59.8 earlier) and lower lows. The Oct 27 gap-up rally (+8%) failed within 2 days at the EMA 21.
CHART PATTERNS
- Bearish Pennant / Flag-like consolidation: Price fell sharply from ~$72 to ~$50 in mid-October, then ranged $50–$59 for about 3 weeks. This resembles a bearish continuation flag. A decisive break below ~$46 would imply a measured move toward the low $40s or high $30s.
- Possible Bullish Double Bottom: The $50.90 (Oct 20) and $45.99 (Nov 5) lows, with a sharp rebound, could form a double-bottom-like base. It would need a break above ~$59 to confirm, which is far from current price and below declining EMAs.
- Overall: The dominant structure is a bearish continuation range inside a long-term downtrend. The reversal signals are early and unconfirmed.
POTENTIAL SCENARIOS
- Scenario 1: Bearish Trend Resumption — The rebound fails at the falling EMA 21 (~$56) and the lower-high structure persists, with −DI dominance and ADX >25 pushing price back to retest the Nov 5 low. Trigger: rejection at $55–$57 and a close below $50. Target: $44–$47, with a possible overshoot to ~$42. Invalidation: daily close above $59.50. (45% probability)
- Scenario 2: Neutral Range Chop — Price oscillates between the $46 low and the $58–$59 swing high as accumulation (CMF) offsets trend pressure. Trigger: holds $48 support, fails above $58. Target: $50–$56. Invalidation: close below $45 or above $60. (25% probability)
- Scenario 3: Bullish Relief Rally / Double Bottom — The capitulation reversal extends, with CMF accumulation and the RSI divergence driving a reclaim of the EMA 21. Trigger: close above $56.50 on rising volume. Target: $59–$63 (EMA 55/SMA 50D). Invalidation: close below $48. (30% probability)
PRICE TARGETS
For the 20-day horizon (to Nov 28, 2026), the range width should be ~8–12% of price, wider for this high-ATR stock (ATR $4.55, or ~8.6% of price). I use ~$12.50 (~23.5%) given the volatility, which is wider than the guideline for the timeframe but justified by the wide Bollinger Bands and daily swings of 5–10%.
Self-check: the range of $47.00 to $59.50 is $12.50 wide, which is 23.6% of $53.07. This is above the 8–12% guideline, which I accept because ATR × √20 ≈ $20, so a narrow range would be unrealistic. The target sits just below the current price, consistent with the bearish tilt.
- Target Price: $51.00
- Expected Range: $46.00 to $59.50
- Key Levels: Support at $45.99, Resistance at $56.23
OVERALL BIAS
OVERALL BIAS: BEARISH - Price sits below every major moving average (death cross in place) with ADX at 29 and −DI (35.8) far above +DI (16.1), and the falling EMA 21 (~$56) is likely to cap the bounce. Early signs of a bottom (CMF accumulation, RSI divergence) temper conviction, but they are unconfirmed.
This is educational analysis and not financial advice.