SMH 20-day bearish forecast — Nov 8, 2026
- Bias: Bearish
- Timeframe: 20 days (made Nov 8, 2026, target date Nov 27, 2026)
- Price at analysis: $463.96
- Price target: $450.00
- Expected range: $424.00 – $478.00
- Result: Pending — graded after the close on Nov 27, 2026
Get a free AI analysis of SMH today
Analysis
TECHNICAL INDICATORS
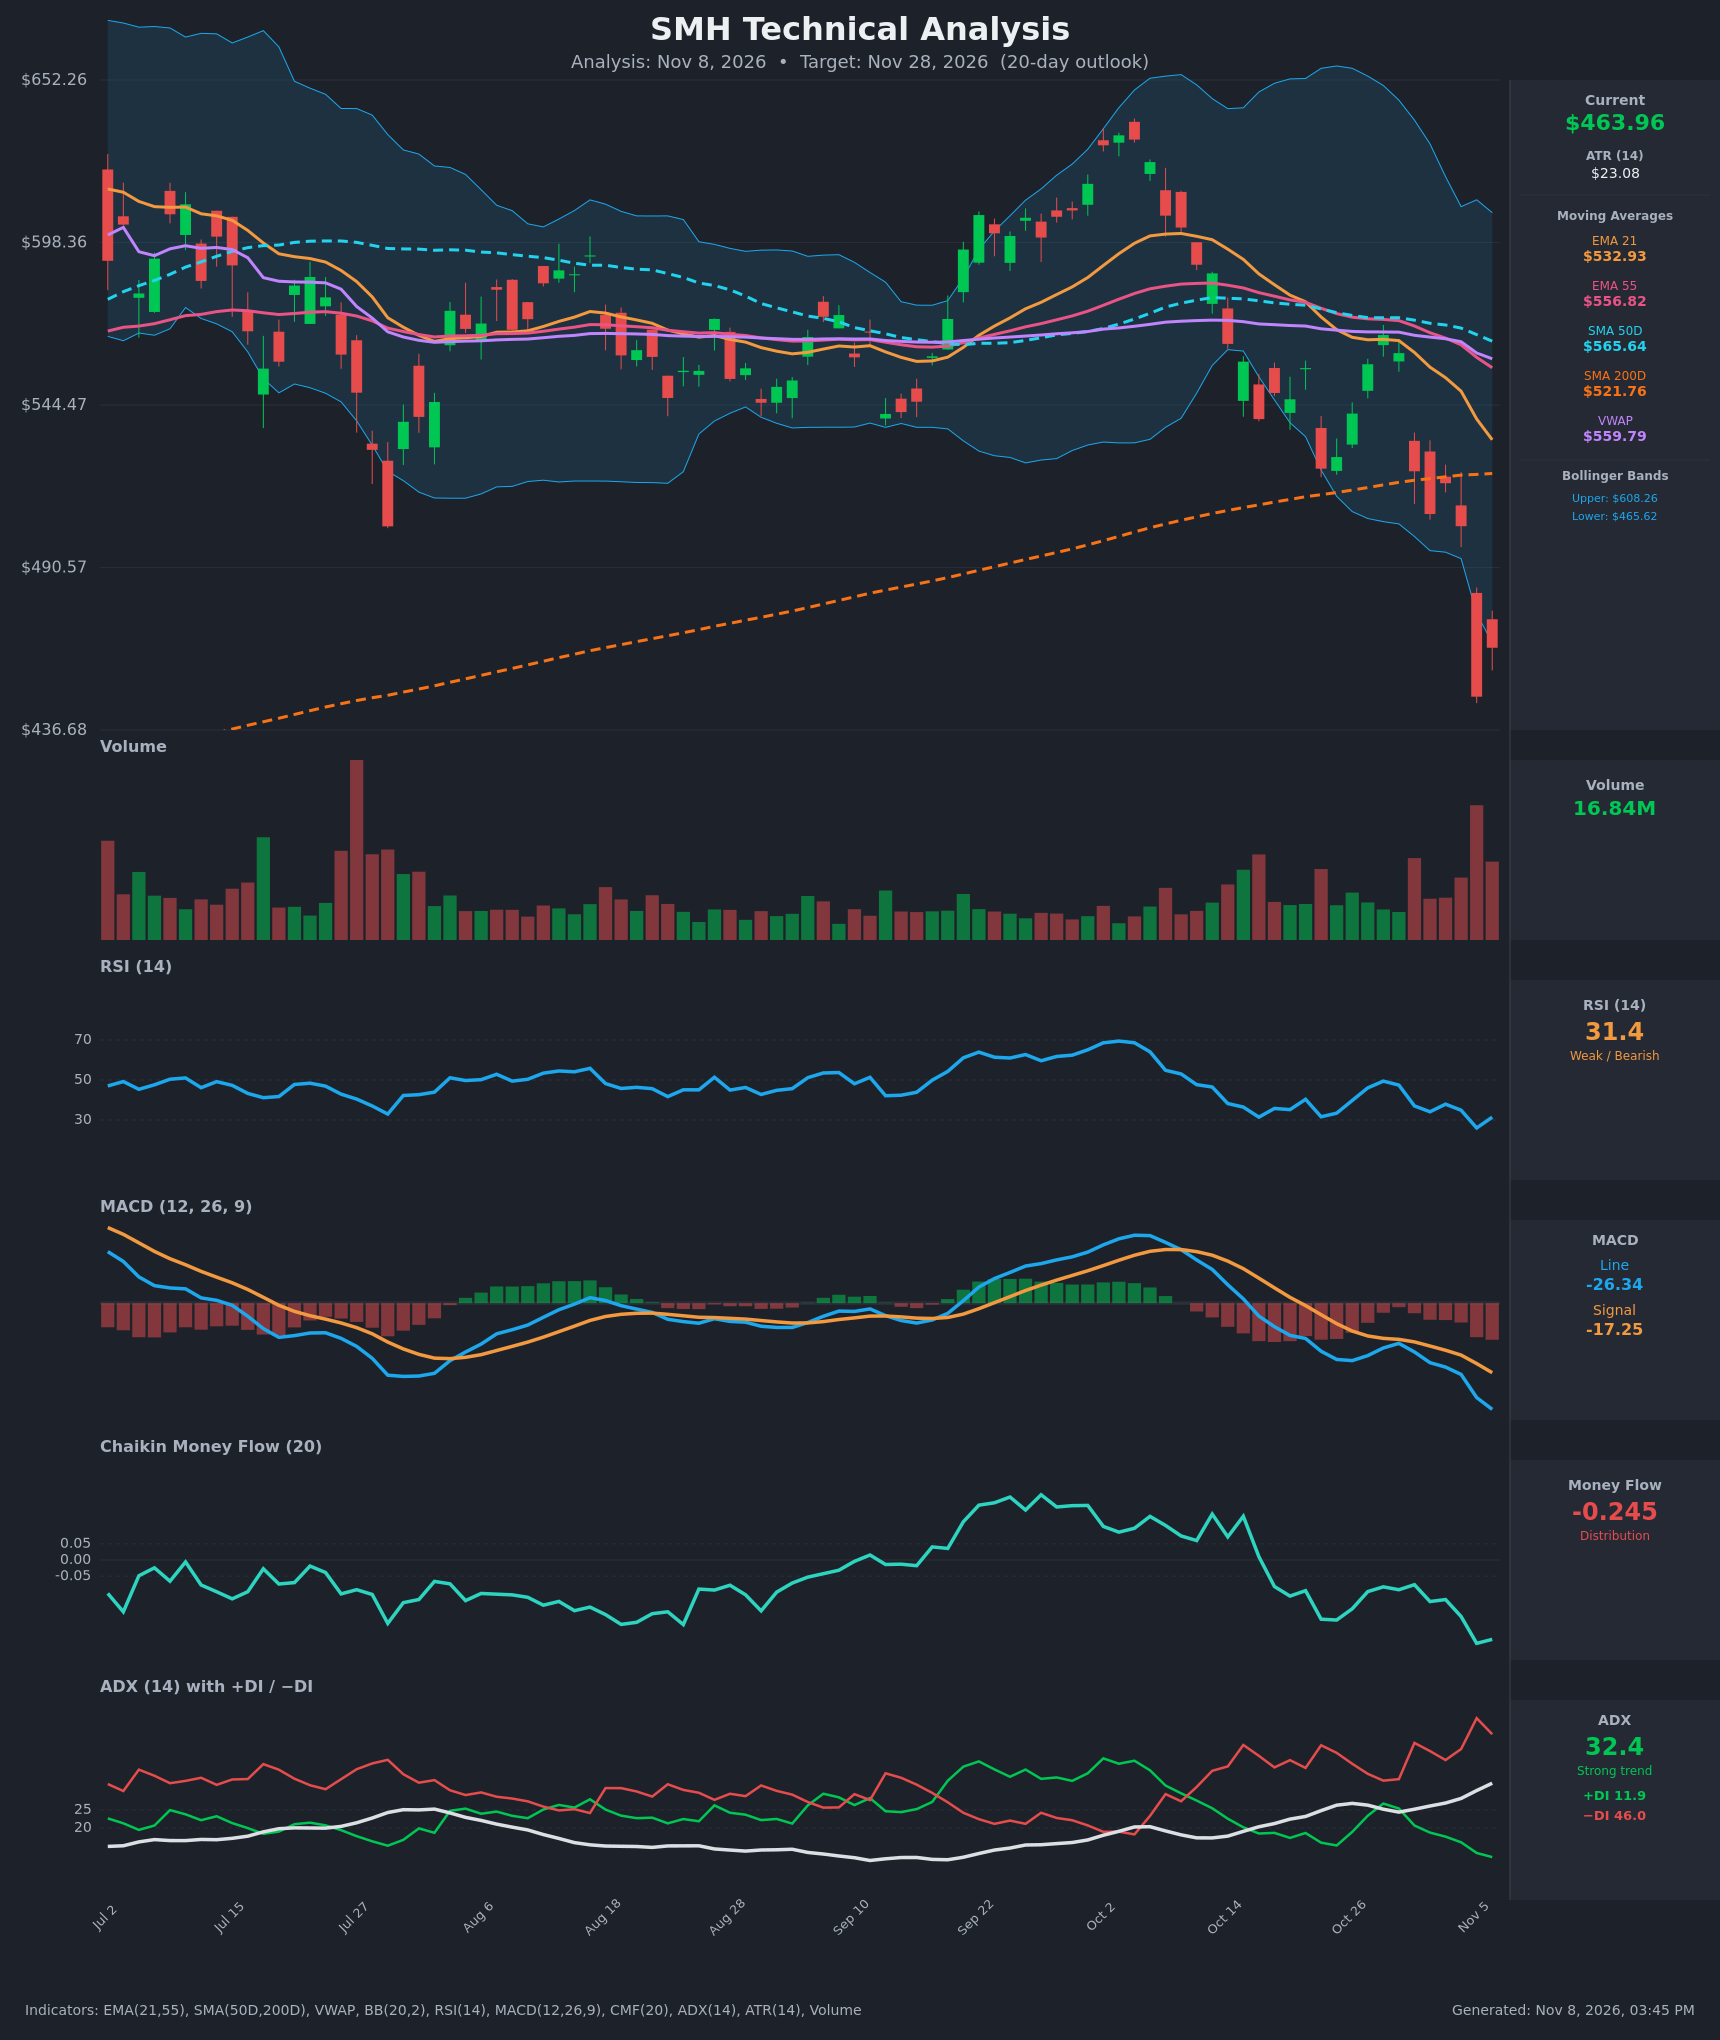
- RSI (14): 31.41, bouncing off 26.0 on Nov 5, the most oversold reading in the visible window. It is still below 35 and has not reclaimed 40, which was the ceiling on every bounce since Oct 22. Oversold conditions raise bounce risk, but momentum remains weak. [Bearish]
- 20 EMA (EMA 21 = $532.93): Price at $463.96 is about 13% below it and the EMA is falling steeply. EMA21 crossed below EMA55 ($556.82) around Oct 22, so the EMA is overhead resistance. [Bearish]
- MACD: Line -26.34 is below signal -17.25, with the histogram widening negative. The bearish crossover came around Oct 20-21, and the line is making new lows, so downside momentum is accelerating. [Bearish]
- Bollinger Bands (20): Price ($463.96) is at or just below the lower band ($465.62), against an upper band of $608.26 and a midline near $537. The bands are expanding after the Nov 5 breakdown candle. Walking the lower band in a strong trend is bearish, though it also flags an extended move prone to a snap-back. [Bearish]
- CMF (20): -0.245, well below the -0.05 threshold and falling from near zero in mid-October. This is sustained distribution with heavy selling pressure. [Distribution]
- ADX (14): 32.4 and rising, with −DI (46.0) far above +DI (11.9). The −DI/+DI spread is very wide, so the trend is strong and in the bears' control. [Strong Trend – Bearish]
- Volume: 16.84M, with the Nov 5 volume spike the largest in the window, on a -11% candle. Heavy volume on the breakdown confirms real selling and is possibly capitulation. The Nov 6 bounce had lower volume than the breakdown day. [Bearish – confirms breakdown, with possible capitulation]
Other context:
- Price is below the SMA200 ($521.76), the SMA50 ($565.64), VWAP ($559.79) and EMA55, so it is below every moving average.
- The SMA50 is still above the SMA200, so there is no death cross yet, but the gap is narrowing.
DIVERGENCES & TRENDS
- No bullish divergence yet. Price made a lower low on Nov 5 and RSI made a lower low (26.0), and MACD and CMF are also at new lows. Momentum is confirming price, not diverging from it.
- Trend deterioration: The Oct high near $640 failed, followed by lower highs ($567 and $557) and now a lower low. Each bounce since Oct 22 was capped by the EMA21/EMA55 area.
- Crossovers and breaks:
- MACD crossed bearishly around Oct 20-21.
- EMA21 crossed below EMA55 around Oct 22.
- −DI overtook +DI around Oct 22-23, and the gap has widened since.
- Price broke below the SMA200 and the late-July swing low near $505.
- Oversold caveat: RSI near 30 and a close at the lower Bollinger Band after a one-day -11% drop make a relief bounce toward $490-$505 plausible. Even then, the EMA21 at $533 should cap any rally.
CHART PATTERNS
- Bearish Double Top (reference diagram): The July high near $620-$630 and the early-October high near $640 form two peaks, with a neckline near $505-$520 (the late-July low). The Nov 5 close at $447.73 broke decisively below that neckline on heavy volume. The measured move (about $135 pattern height) points toward roughly $370. That is a multi-week to multi-month objective, so only part of it is likely within 20 days.
- Breakdown from the Aug–Sep range: Price spent a long time between about $520 and $570 and has now fallen out the bottom of it. The old range floor, near $505-$520, should now act as resistance.
- Retests of the broken neckline and the SMA200 from below are a common way for this pattern to resolve.
POTENTIAL SCENARIOS
- Scenario 1: Bearish Trend Continuation / Double Top Measured Move — The breakdown below the neckline and SMA200 continues. The wide −DI/+DI spread, falling CMF and MACD suggest sellers stay in control, and bounces fail near the lower-band or EMA area. Trigger: a close below $447.73, or a failed bounce below $480-$490. Target: $440 first, then $425-$420 (about 1 ATR below the Nov 5 low). Invalidation: a daily close above $505 (the broken neckline). (50% probability)
- Scenario 2: Bullish Oversold Relief Bounce — RSI at 26-31 and price at the lower band after a capitulation-style volume spike invite a mean-reversion rally. Price retraces toward the $490-$505 gap area but stays below the falling EMA21. Trigger: a close above $480 with RSI back above 40. Target: $495-$505. Invalidation: a close below $447.73. (38% probability)
- Scenario 3: Neutral Basing Range — Price stabilizes after the shock and chops between roughly $445 and $485 without a clear break. The strong ADX makes a pure sideways outcome less likely. Trigger: several inside-range closes with falling ATR and a flat MACD histogram. Target: about $465. Invalidation: a close outside $445-$485. (12% probability)
PRICE TARGETS
- Target Price: $450.00 (20-day horizon, Nov 28)
- Expected Range: $424.00 to $478.00 (width $54, about 11.6% of the current price, consistent with the 14-21 day guidance)
- Key Levels: Support at $447.73 (Nov 5 closing low, with intraday lows near $440 below it), Resistance at $504.27 (Nov 4 close and broken neckline area). The first minor resistance is the lower Bollinger Band at $465.62, and the EMA21 at $532.93 is the major ceiling.
OVERALL BIAS
OVERALL BIAS: BEARISH - Price is below every major moving average and has broken the double-top neckline and the SMA200 on heavy volume. ADX is rising at 32 with −DI far above +DI, and MACD and CMF are both making new lows. A relief bounce is possible given the oversold RSI, but the trend evidence favors further downside within 20 days.
This is educational analysis and not financial advice.