SOXS 20-day bearish forecast — Nov 8, 2026
- Bias: Bearish
- Timeframe: 20 days (made Nov 8, 2026, target date Nov 27, 2026)
- Price at analysis: $70.95
- Price target: $61.50
- Expected range: $57.50 – $66.00
- Result: Pending — graded after the close on Nov 27, 2026
Get a free AI analysis of SOXS today
Analysis
TECHNICAL INDICATORS
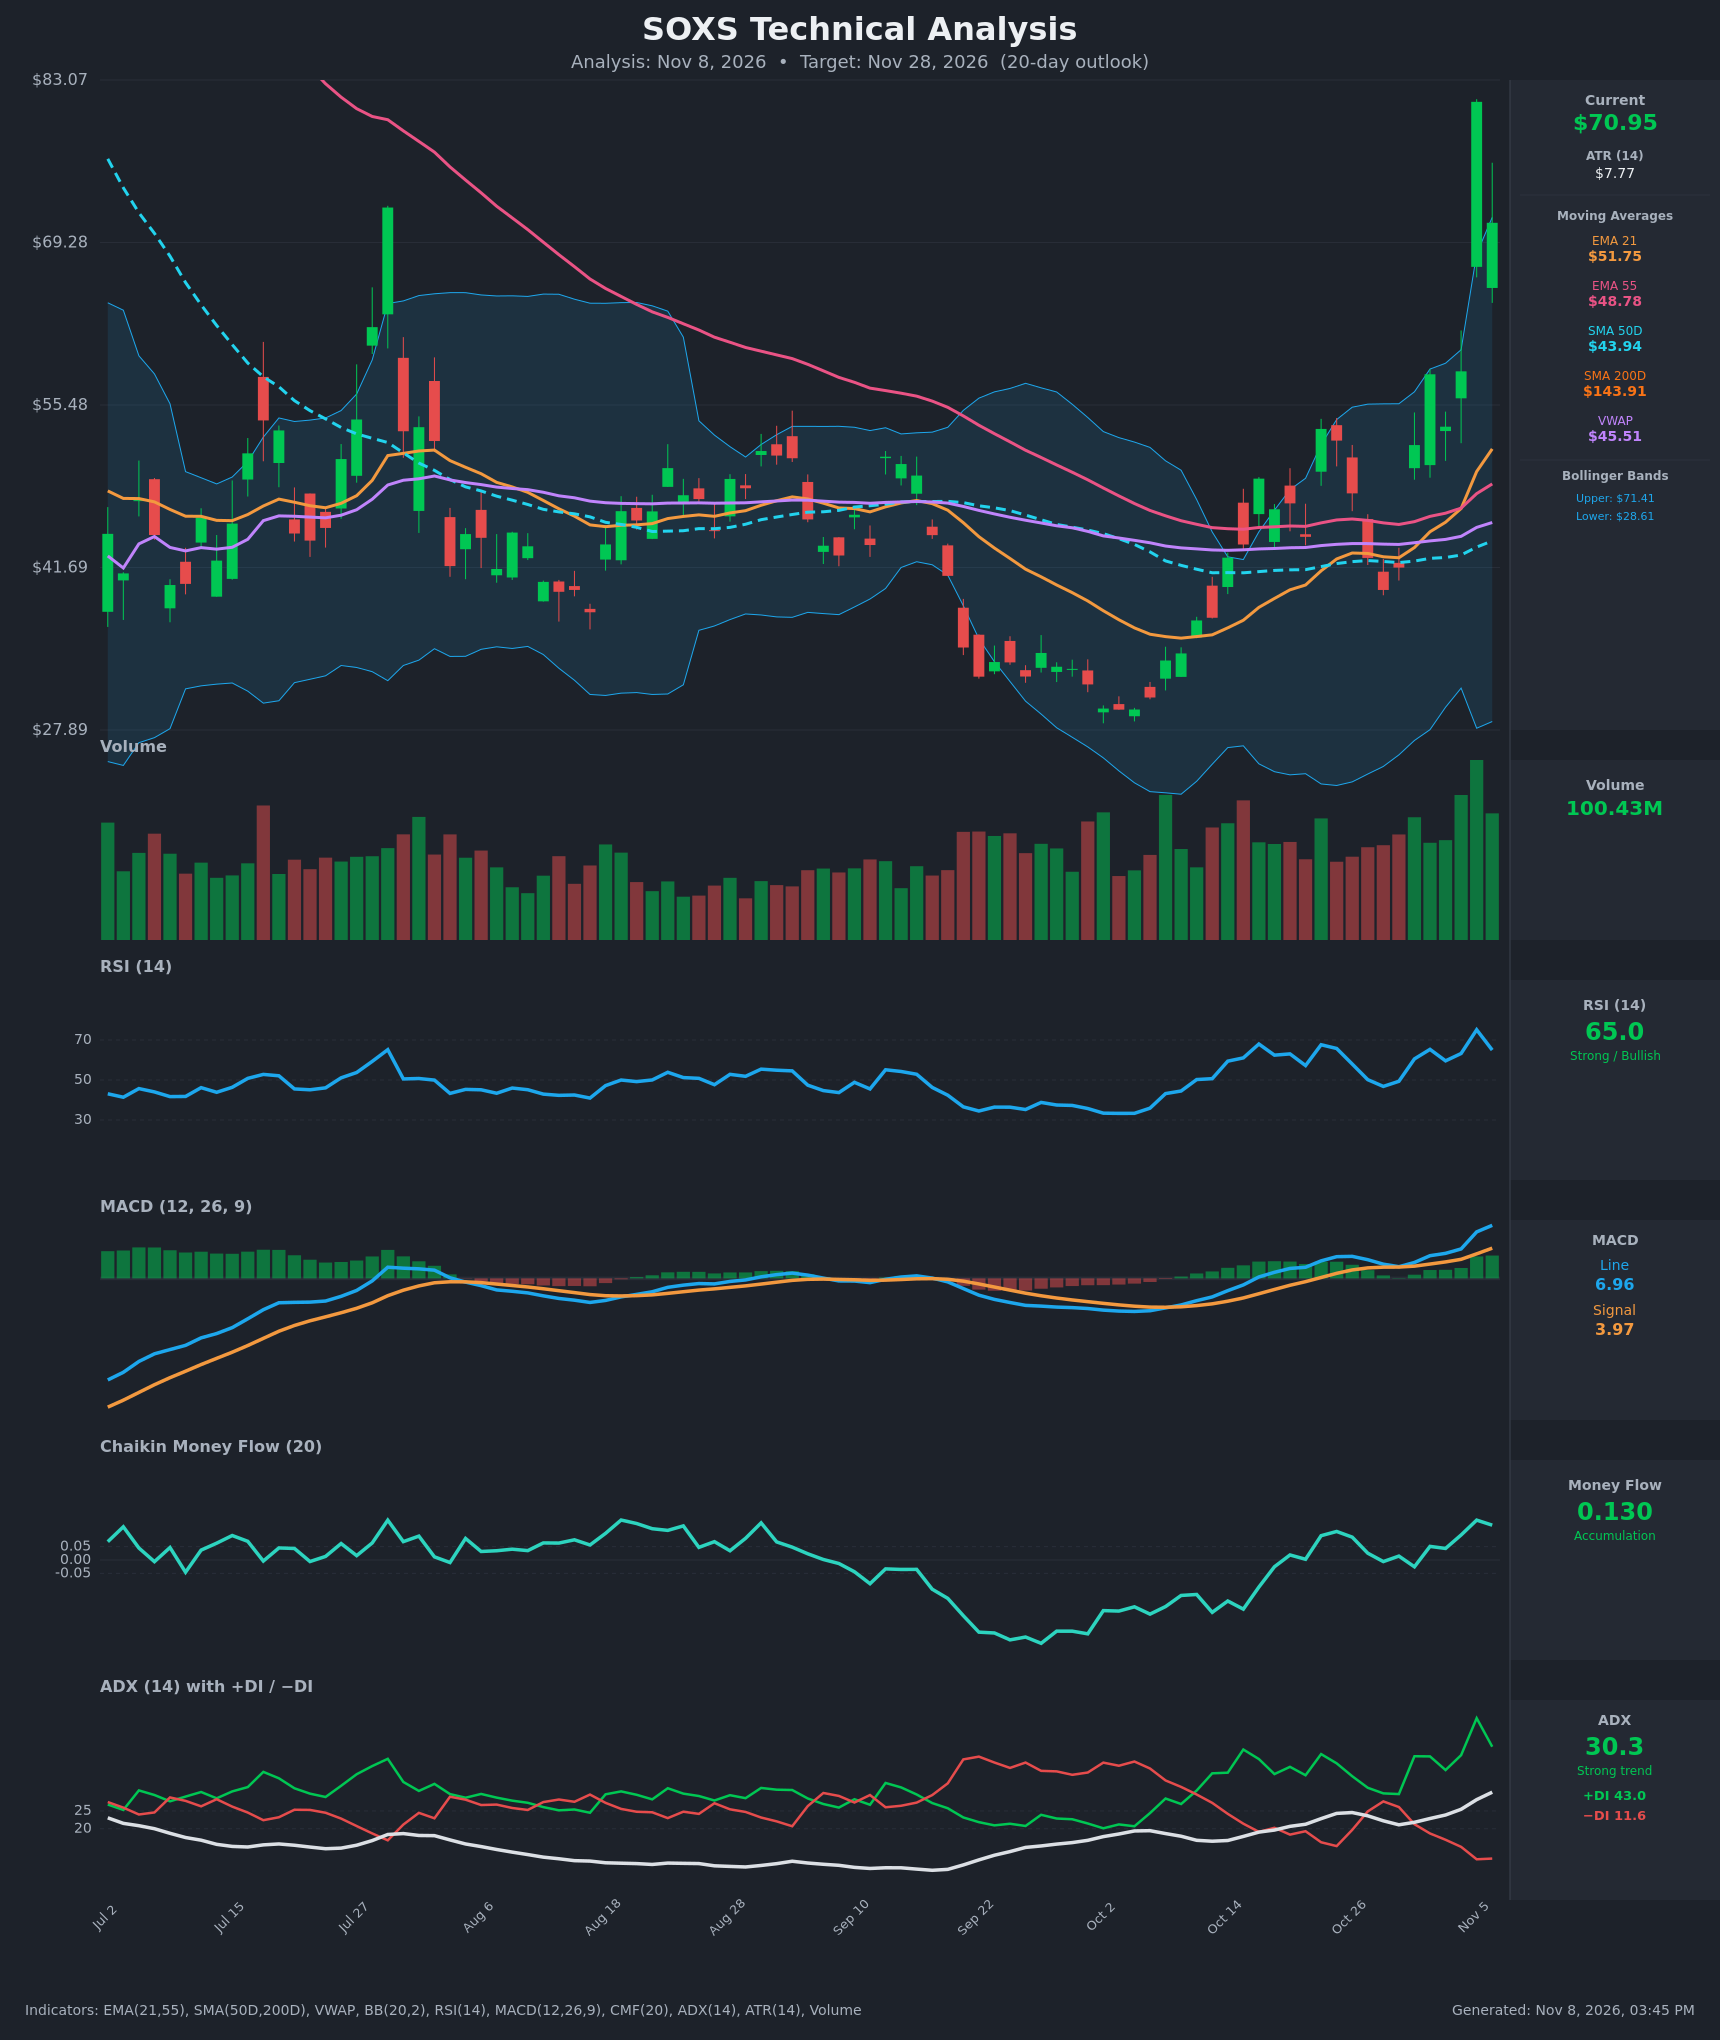
- RSI (14): 64.97, down from 75.1 on Nov 5 (overbought) after a one-day pullback. The reading is still strong, but momentum is rolling over from an extreme. [Neutral]
- 20 EMA (EMA 21 = $51.75): Price at $70.95 is about 37% above it. The EMA is rising and acts as support, but the stretch is extreme and usually mean-reverts. EMA21 ($51.75) is above EMA55 ($48.78), so the short-term trend is up. [Bullish]
- MACD: Line 6.96 is above signal 3.97 and the histogram is about +2.99 and expanding. The bullish crossover was on Oct 22, and the line is far from zero and extended. [Bullish]
- Bollinger Bands (20): Upper $71.41, lower $28.61. Price at $70.95 sits at the very top of the band (%B ≈ 0.99) after a spike that went well outside it. The bands are very wide. Closing at the upper band after a blow-off wick tends to bring consolidation or a pullback. [Bearish]
- CMF (20): 0.130, above +0.05 and rising since mid-October. This shows genuine buying pressure and accumulation. [Accumulation]
- ADX (14): 30.3 and rising, with +DI 43.0 well above −DI 11.6. This is a strong uptrend, but +DI has fallen from 51.0 after the spike. [Strong Trend + Bullish]
- Volume: 100.43M, among the highest on the chart. The Nov 5 spike to $81.22 on huge volume was followed by a −12.6% reversal day. That is a climactic or blow-off pattern. [Climactic / Exhaustion Risk]
Other context: price is above VWAP ($45.51), SMA50D ($43.94) and both EMAs. The SMA200D of $143.91 is far above price and falling, so the long-term structure is still a downtrend with no golden cross. The SMA200D value is probably distorted by a reverse split in this leveraged ETF.
DIVERGENCES & TRENDS
- RSI vs price: There is no classic divergence. RSI peaked at 75.1 on the spike day and has dropped to 65 as price pulled back about 12.6%, which is early momentum deceleration.
- MACD: The bullish crossover from Oct 22 is intact and the histogram is expanding. It is at the highest level on the chart, which is typical near short-term peaks.
- CMF and ADX: CMF is rising and positive, and ADX is climbing through 30, confirming real trend strength. +DI has rolled over from 51 to 43.
- EMA/SMA: The EMA21/EMA55 bullish crossover occurred on about Nov 4. SMA50D is still well below SMA200D (no golden cross).
- Price structure: The Oct 2 low near $29 was followed by higher lows. The Nov 5 candle has a long upper wick, and the Nov 6 candle closed well below the spike, a possible bearish reversal.
- Instrument: SOXS is a 3x inverse semiconductor ETF. It is prone to sharp spikes and mean reversion, and to volatility decay over time.
CHART PATTERNS
- No clean textbook pattern from the reference diagram fully matches. The closest is a Bullish Double Bottom / base breakout (low near $29 in early October, then higher lows and a breakout above the $53–58 range). The measured move would be higher, but that breakout has been stretched by a single vertical spike.
- Blow-off / shooting-star style reversal at $81.22. This is not in the diagram, but it is significant because it caps the move at resistance. A pullback toward the prior breakout zone ($58) is the natural retest, which would be healthy for the bullish structure.
- Targets: A retest of the $58 breakout level (the Nov 2–4 closes) is the primary downside target. A close above $81.22 would open a run toward $90+.
POTENTIAL SCENARIOS
- Scenario 1: Bearish Post-Spike Mean Reversion — The blow-off reversal on heavy volume and the extreme extension above EMA21 lead to a pullback toward the breakout area. Trigger: close below $65 and a loss of the Nov 3–4 area. Target: $58–$62, with an extension to the $52 EMA21 if selling accelerates. Invalidation: a daily close above $76. (50% probability)
- Scenario 2: Bullish Trend Continuation — ADX above 30, +DI dominance and CMF accumulation keep the trend running, and price retests and breaks $81.22. Trigger: close above $75 on strong volume. Target: $82–$90. Invalidation: a close below $58. (35% probability)
- Scenario 3: Neutral High-Level Consolidation — Price digests the spike in a wide $60–$75 range. Trigger: several closes between $62 and $74 with falling volume. Target: about $68. Invalidation: a close outside $58–$78. (15% probability)
PRICE TARGETS
- Target Price: $61.50 (20-day, Nov 28, 2026)
- Expected Range: $57.50 to $66.00. Width is $8.50, or 12.0% of the current price, which matches the 14–21 day guidance. Realized volatility is far above normal (ATR ≈ 11% of price), so tails beyond this range are likely.
- Key Levels: Support at $58.00 (prior breakout area, Nov 2–4 closes) and $51.75 (EMA21). Resistance at $81.22 (Nov 5 spike high), with the Bollinger upper band at $71.41 as near-term resistance.
OVERALL BIAS
OVERALL BIAS: BEARISH - Price is extremely extended (about 37% above EMA21 and pinned at the upper Bollinger Band) after a climactic, high-volume spike. RSI and +DI are rolling over from extremes. A leveraged inverse ETF is likely to mean-revert toward the $58–$62 breakout zone, although the underlying trend indicators remain bullish and keep conviction modest.
This is educational analysis and not financial advice.