SOFI 20-day bearish forecast — Nov 8, 2026
- Bias: Bearish
- Timeframe: 20 days (made Nov 8, 2026, target date Nov 27, 2026)
- Price at analysis: $16.21
- Price target: $15.70
- Expected range: $14.95 – $16.80
- Result: Pending — graded after the close on Nov 27, 2026
Get a free AI analysis of SOFI today
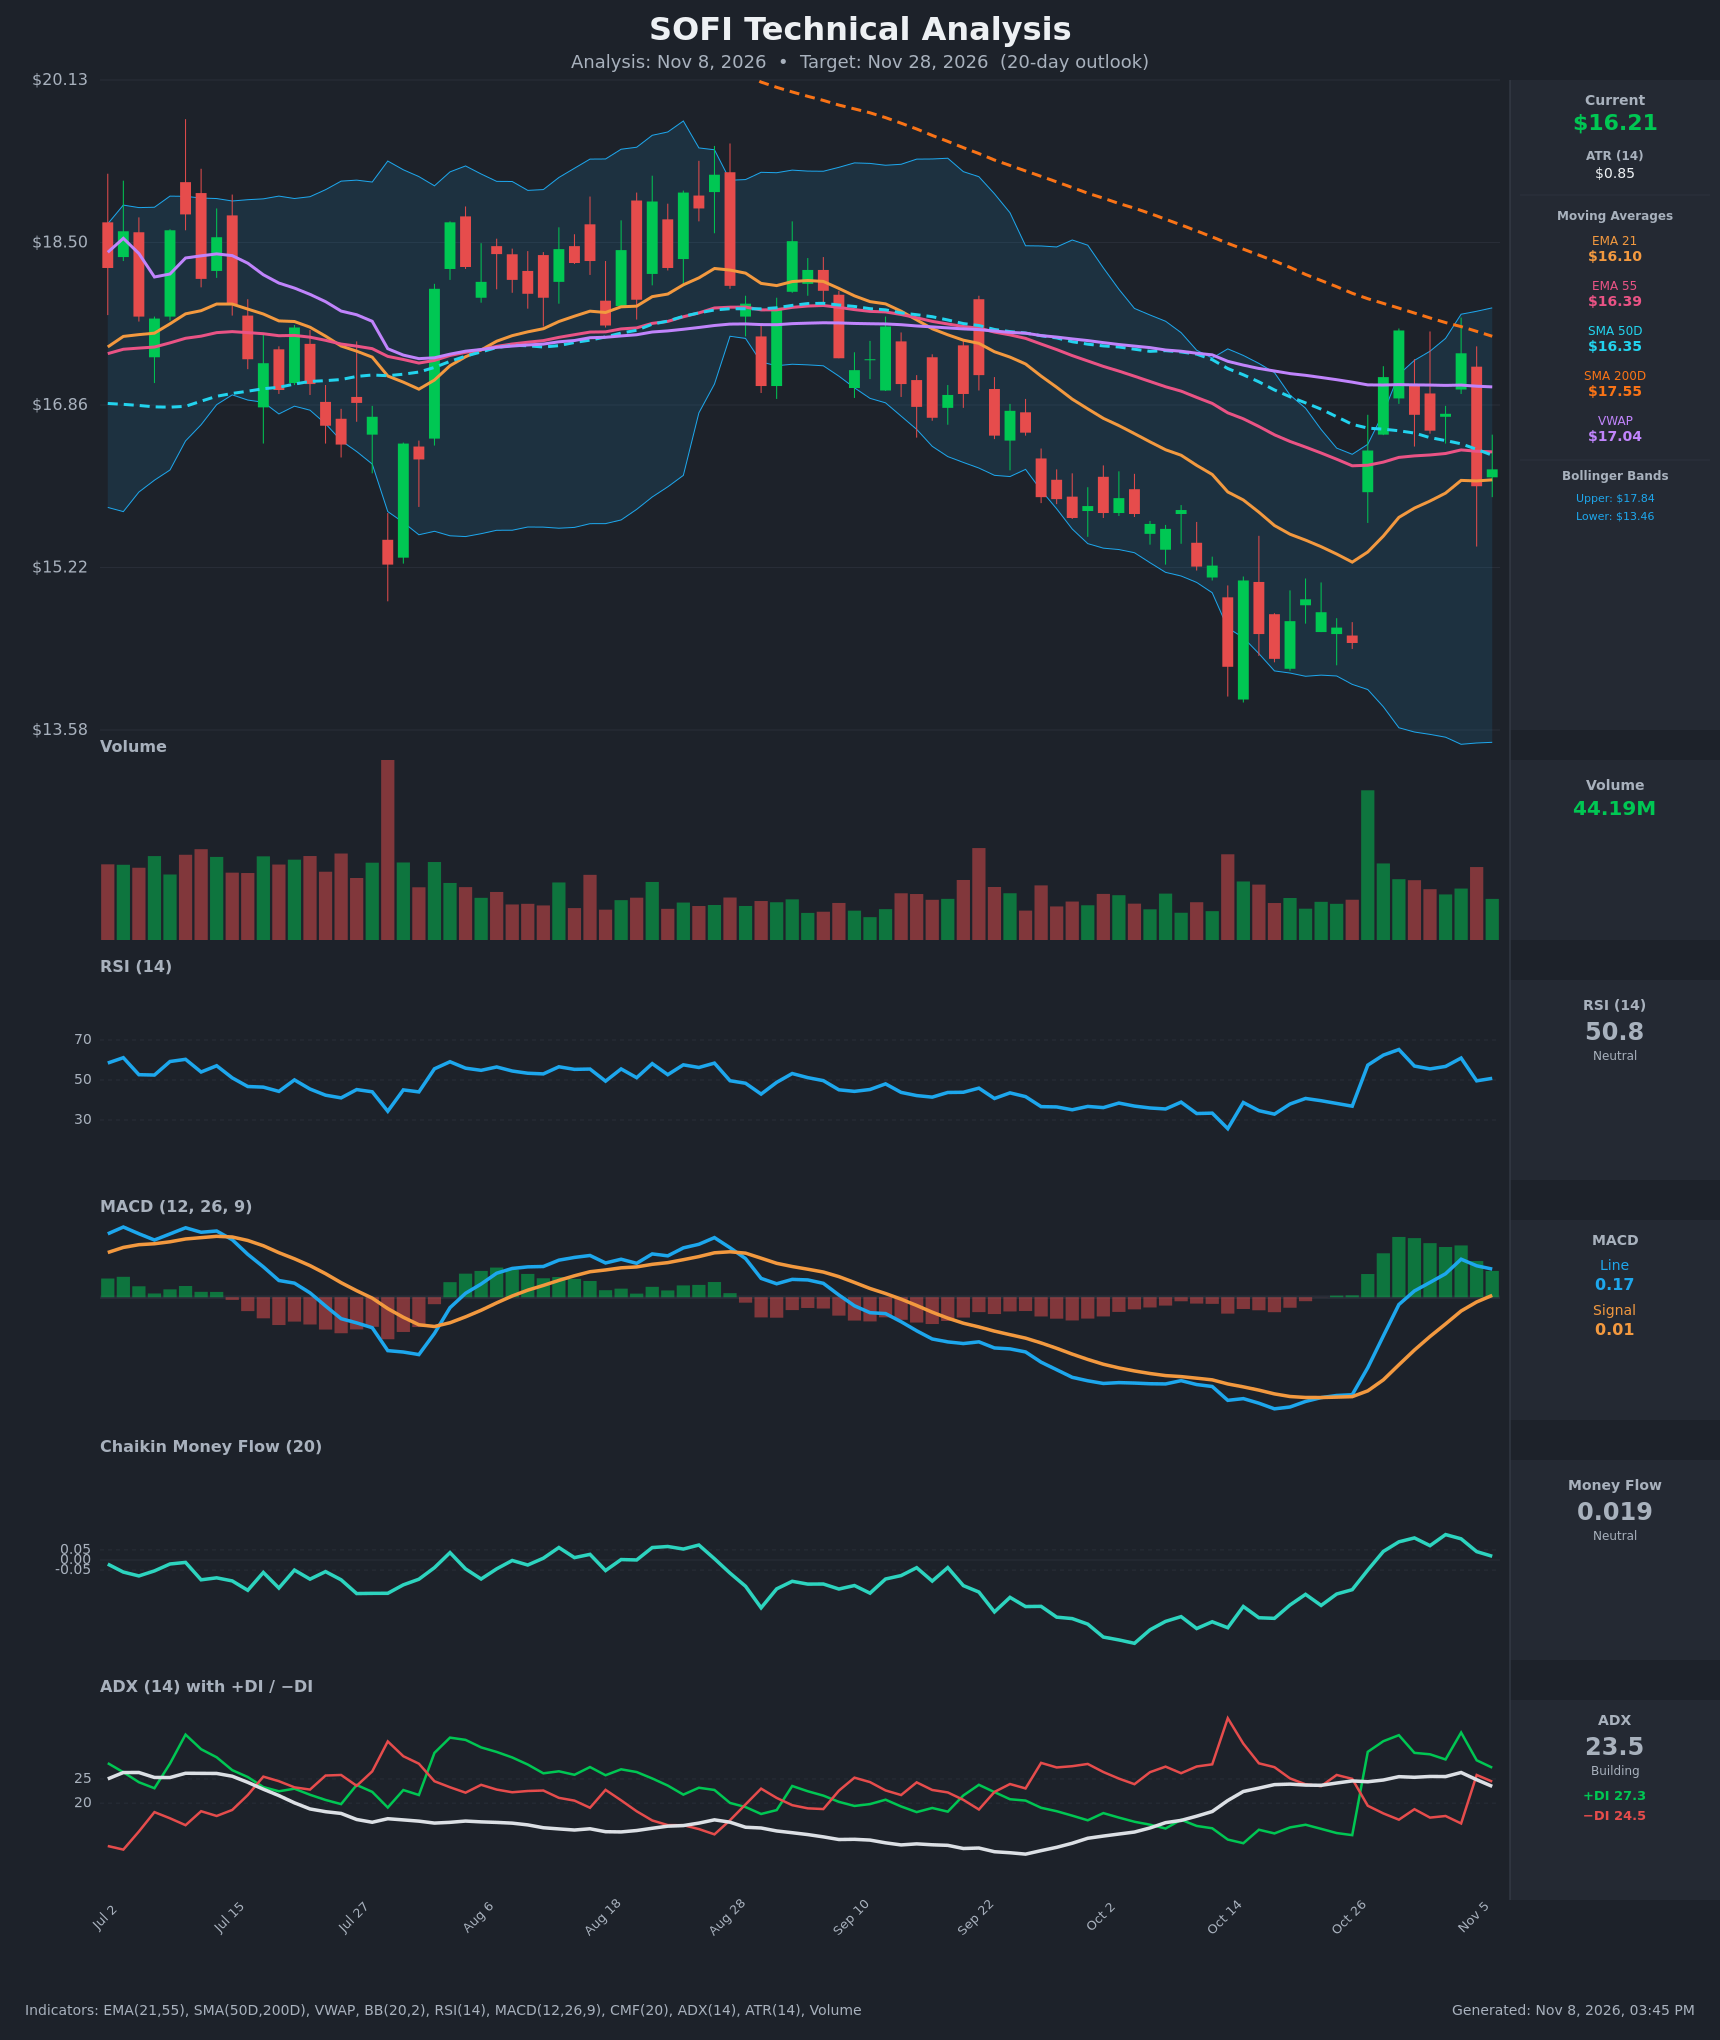
Analysis
TECHNICAL INDICATORS
- RSI (14): 50.83, dead neutral. It fell from 61.0 on Nov 4 to 49.6 on Nov 5 after the sharp reversal candle, so momentum has faded from the 65 peak on Oct 29. It has retraced the whole oversold recovery (32.9 to 65.2) and is no longer rising. [Neutral]
- 20 EMA (21 on the data): $16.10, and price at $16.21 is only slightly above it. The EMA21 is rising but still below EMA55 ($16.39) and SMA50D ($16.35), so there is no bullish EMA cross yet. The EMA21 is the first support, and price is hugging it. [Neutral]
- MACD: Line 0.172 is above signal 0.011, with a positive histogram of about +0.16. The bullish crossover happened on Oct 30. However, the histogram has shrunk from about +0.32 (Nov 4) and the line is turning down (0.232 to 0.192 to 0.172), so bullish momentum is decaying. [Neutral]
- Bollinger Bands (20): Upper $17.84, lower $13.46, midline about $15.65. Price sits in the upper-middle of a very wide band, so volatility is elevated after the Oct 14 low and the Oct 27 gap. The Nov 4 high near $17.4 failed well inside the upper band, which shows buyers lacked follow-through. The bands offer no squeeze or breakout signal. [Neutral]
- CMF (20): 0.019, inside the neutral zone (±0.05). It peaked at 0.126 on Nov 3 and has faded to near zero, so accumulation is not being sustained. Oct 27-Nov 4 was briefly accumulative. [Neutral]
- ADX (14): 23.5 and falling from 26.3, with +DI at 27.3 above −DI at 24.5. The DI spread narrowed sharply from 34.6/15.8 on Nov 4, and −DI jumped on the Nov 5 red candle. The trend is weak-to-moderate and bulls hold only a slim edge. [Weak Trend, slight bullish DI edge]
- Volume: 44.19M on the latest bar, which is a modest figure. The big volume spike came on the Oct 27 gap-up. The Nov 5 reversal candle also printed heavy red volume, a sign of supply near $17.4. Volume is not confirming the recovery. [Mild distribution at the highs]
DIVERGENCES & TRENDS
- Price made a lower high on Nov 4 ($17.38 vs $17.61 on Oct 29). The MACD line made a higher high (0.232 vs -0.044), so there is no bearish divergence. It is simply a lagging line in recovery.
- The MACD histogram is declining and the line is turning down while still above signal. Momentum is cooling and a re-cross lower is possible within days if price stays flat or slips.
- Price is below the SMA200D ($17.55), VWAP ($17.04), EMA55 ($16.39) and SMA50D ($16.35). The SMA50D is below the SMA200D (a death-cross regime), and the falling orange trendline from Aug 28 sits near $17.4 on the chart.
- EMA21 ($16.10) is converging with EMA55 ($16.39) from below. A bullish cross is possible, but price must hold above $16.0 for that to matter.
- CMF and ADX are both fading from the Nov 3-4 highs, so the post-Oct 27 impulse is losing strength.
- The DI spread collapsed from +18.8 to +2.8 in two sessions, so bullish control is fragile.
CHART PATTERNS
- Descending resistance line (Aug 28 to present): The line near $17.4 caps the rally. This resembles the Descending Triangle / downtrend channel in the reference, but there is no flat support base, so it is only partially matching.
- Post-spike consolidation (Oct 27 to Nov 6): Price is chopping between about $16.0 and $17.6 after a sharp V-bounce from $14.0-14.5. This is most like a Bullish Flag or Pennant, but the lower high at $17.38 and the rejection back to $16.04 make it closer to a failed breakout. A hold above $16.0 keeps the flag alive (target around $17.6-$18.0). A break below $16.0 would fade the bounce toward $15.2-$15.5.
- No confirmed reversal pattern is present. The range of $16.0 to $17.6 is the key structure.
POTENTIAL SCENARIOS
- Scenario 1: Bearish Failed Bounce Fades Back Toward $15.5 — Sellers defend the $16.4-$17.0 cluster (EMA55, SMA50D, VWAP, falling trendline). Price breaks below the Nov 5 low of $16.04. The MACD re-crosses down and the death-cross regime asserts itself. Trigger: daily close below $16.00 with RSI under 45. Target: $15.50, then $15.20. Invalidation: daily close above $17.05 (VWAP) on rising volume. (45% probability)
- Scenario 2: Neutral Range Chop — Price oscillates between $16.0 and $17.0 as the EMA21/EMA55/SMA50D cluster pulls it sideways. ADX stays under 25. Trigger: closes between $16.00 and $17.00 with a flat MACD histogram. Target: $16.20-$16.60. Invalidation: a close outside $15.90-$17.10. (22% probability)
- Scenario 3: Bullish Flag Breakout — Price holds above the EMA21/$16.0 and reclaims the EMA55/SMA50D. It pushes through VWAP and the falling trendline to retest $17.6-$17.8. Trigger: daily close above $17.05 with +DI widening and CMF above 0.05. Target: $17.60, then $17.84 (upper band). Invalidation: close below $16.00. (33% probability)
PRICE TARGETS
- Target Price: $15.70 (20-day, about -3.1% from $16.21)
- Expected Range: $14.95 to $16.80. Width is $1.85, about 11.4% of the current price, which fits the 14-21 day guidance of 8-12%.
- Key Levels: Support at $15.50, Resistance at $17.04
OVERALL BIAS
OVERALL BIAS: BEARISH - Price sits below the SMA200D, VWAP, EMA55 and SMA50D under a falling trendline. The last rally failed at a lower high ($17.38) with a heavy-volume reversal. MACD momentum, CMF and ADX are all fading while RSI sits at neutral, so a drift back toward $15.5-$15.7 is more likely than a breakout. Conviction is modest, since the MACD is still positive and +DI still leads.
This is educational analysis and not financial advice.