SPY 20-day bearish forecast — Nov 8, 2026
- Bias: Bearish
- Timeframe: 20 days (made Nov 8, 2026, target date Nov 27, 2026)
- Price at analysis: $735.29
- Price target: $722.00
- Expected range: $690.00 – $765.00
- Result: Pending — graded after the close on Nov 27, 2026
Get a free AI analysis of SPY today
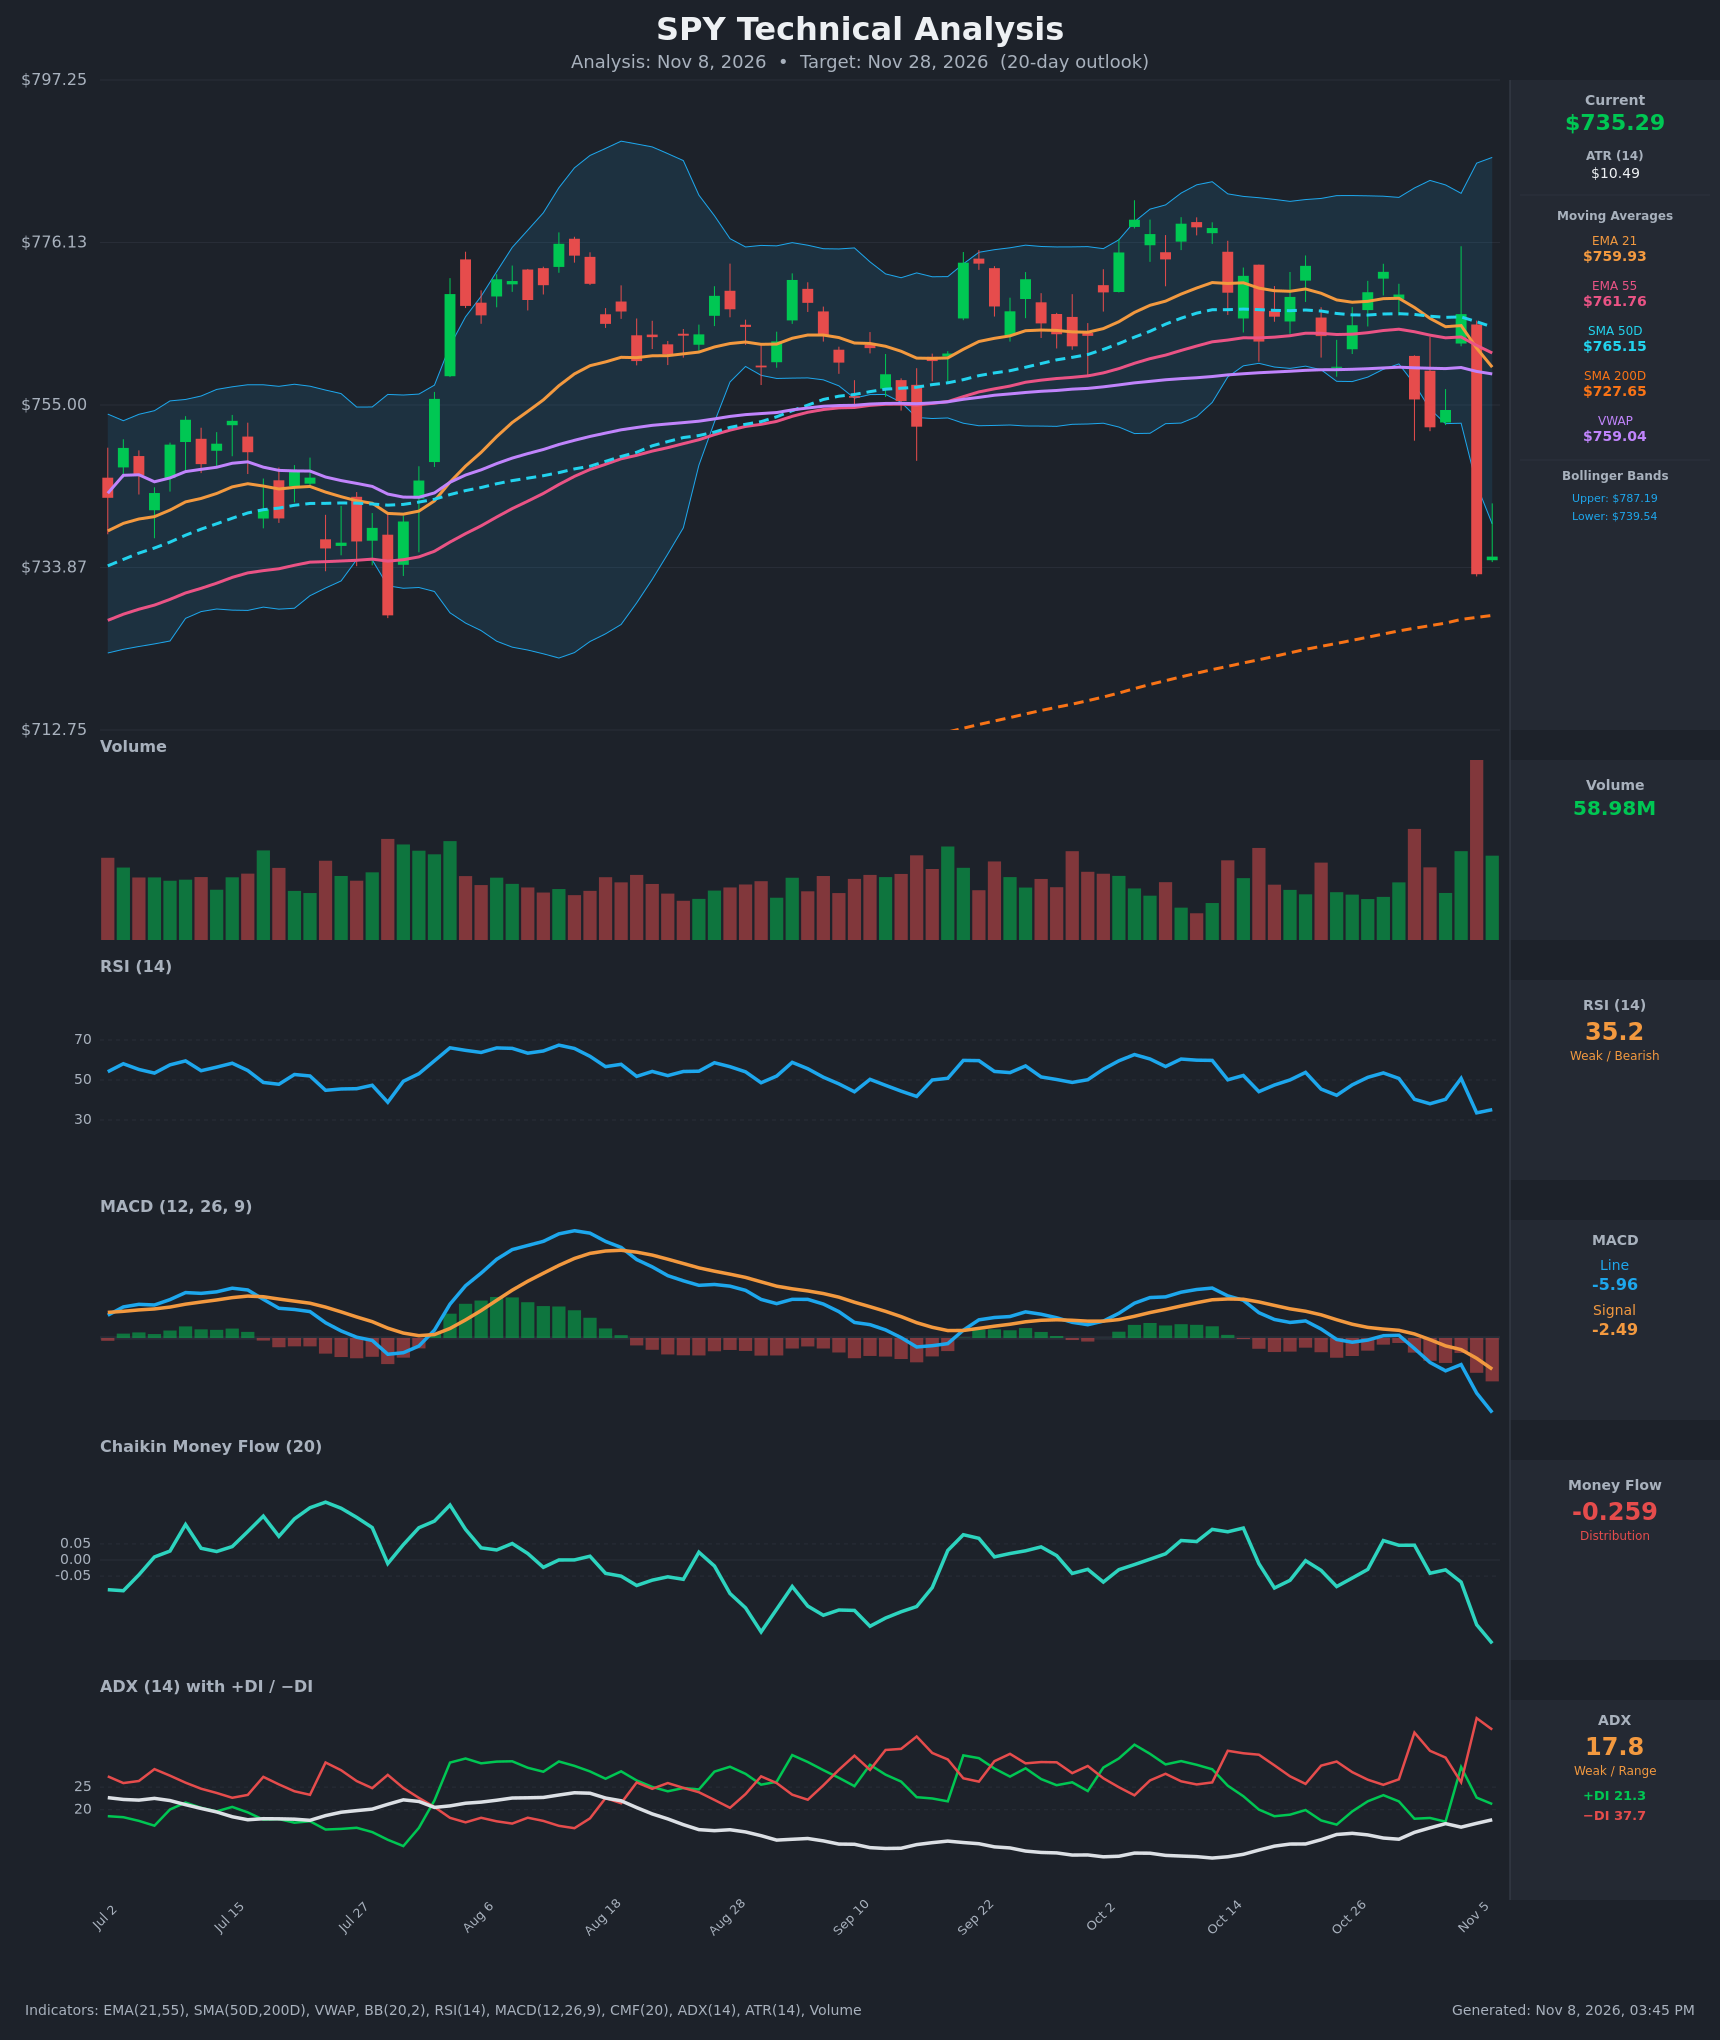
Analysis
TECHNICAL INDICATORS
- RSI (14): 35.18, down from about 51 on Nov 4 and 33.6 on Nov 5. It is near oversold but not yet below 30, and the slope is still down, so selling momentum is intact. [Bearish]
- 20 EMA: The 21 EMA is $759.93, about 3.3% above the $735.29 close. Price has been below it for three sessions, and the average is rolling over. It also just crossed below the 55 EMA ($761.76) on Nov 5-6, a bearish EMA cross. [Bearish]
- MACD: The line is -5.96, below the signal at -2.49. It crossed down on Oct 30, and the negative histogram is widening, which means accelerating downside momentum. [Bearish]
- Bollinger Bands (20): The bands run $739.54 to $787.19. The close is below the lower band, so the move is statistically stretched. After a high-volume breakdown the lower band is acting as a "walk" signal rather than a clean reversal trigger. The bands are wide, which shows elevated volatility. [Bearish]
- CMF (20): -0.259 is deep in distribution territory and fell sharply from -0.03 to -0.07 a few days ago. That is the weakest reading on the chart, so selling pressure is heavy. [Distribution]
- ADX (14): 17.8 and slowly rising from 11.9, with −DI at 37.7 against +DI at 21.3. The trend is still technically weak, but the bears clearly control direction and the DI spread is wide. A rising ADX would confirm a new downtrend. [Weak Trend, Bearish Direction]
- Volume: The Nov 5 breakdown candle (-$33.8, about -4.4%) came on the highest volume on the chart. Nov 6 printed 58.98M on a small bounce candle. The spike is distribution or capitulation, and the follow-through bounce is so far unconvincing. [Bearish, possible capitulation]
Other levels:
- Moving averages: Price is below the 21 EMA, 55 EMA, SMA50 ($765.15) and VWAP ($759.04). The SMA200 at $727.65 is the only support nearby, just 1% below price. The SMA50 is well above the SMA200, so there is no death cross.
DIVERGENCES & TRENDS
- There is no bullish RSI or MACD divergence. Both are making new lows with price, so momentum confirms the decline.
- The RSI low of 33.6 on Nov 5 was marginally tested on Nov 6 with a higher close (35.2). This is a tiny stabilization, not a divergence.
- CMF has fallen to its lowest level of the whole chart, and RSI is also at its lowest level in months. Both are at 4-month extremes, which confirms the breakdown.
- Price has broken out of the Aug-Oct $755-$780 range to the downside.
- The 21 EMA crossed below the 55 EMA and the MACD crossed below its signal. −DI is far above +DI after a brief +DI spike on Nov 4.
- The SMA200 is rising and acts as the last support.
CHART PATTERNS
- Bearish Double Top / range distribution: There are two highs near $777-$780 (Aug and Oct) and neckline support around $755. Price has broken below that neckline on heavy volume. The measured move (about $23 of height from the $755 neckline) projects to about $732, which is already nearly reached. A move to the SMA200 and slightly below is the next logical area.
- Failed bounce / lower highs: The Oct 28-Nov 4 rebound failed below the 21 EMA and the SMA50. It is similar to a bearish flag or pennant that broke down.
- Caveat: The reversal diagrams show that a Bullish Double Bottom or Triple Bottom needs a confirmed base first. None exists yet. A reclaim of $752-$760 would negate the bearish pattern.
POTENTIAL SCENARIOS
- Scenario 1: Bearish SMA200 Break and Continuation — Price breaks the $727.65 SMA200 after a weak bounce fails at the lower band. Bears keep control with −DI far above +DI and ADX rising. Trigger: daily close below $727.65. Target: $705-$715, then the $690s if the selling accelerates. Invalidation: daily close above $752. (50% probability)
- Scenario 2: Bullish Oversold Bounce — Climax volume plus RSI near 30 and the SMA200 hold lead to a relief rally toward the prior breakdown area. Trigger: reclaim of $739.54 (lower band) and then $745. Target: $752-$760 (EMA21/VWAP area). Invalidation: close below $727. (35% probability)
- Scenario 3: Neutral Choppy Base — Price consolidates around the SMA200 between $720 and $745 as volatility compresses. Trigger: ADX stays below 20 and RSI hovers at 35-45. Target: $730-$740. Invalidation: a close outside $715-$750. (15% probability)
PRICE TARGETS
- Target Price: $722.00 (20-day horizon)
- Expected Range: $690.00 to $765.00. Width is $75, which is 10.2% of the current price and in line with the 14-21 day guidance.
- Key Levels: Support at $727.65 (SMA200), Resistance at $752.10 (Nov 2 close and the lower end of the failed bounce)
OVERALL BIAS
OVERALL BIAS: BEARISH - Price broke down on record volume and sits below every moving average. MACD, CMF and DI all point down, and the 21/55 EMA cross has turned bearish. The nearby SMA200 and a stretched RSI limit the downside, so conviction is modest and rebounds are likely along the way.
This is educational analysis and not financial advice.