XLF 20-day bullish forecast — Nov 8, 2026
- Bias: Bullish
- Timeframe: 20 days (made Nov 8, 2026, target date Nov 27, 2026)
- Price at analysis: $57.16
- Price target: $58.00
- Expected range: $54.20 – $59.80
- Result: Pending — graded after the close on Nov 27, 2026
Get a free AI analysis of XLF today
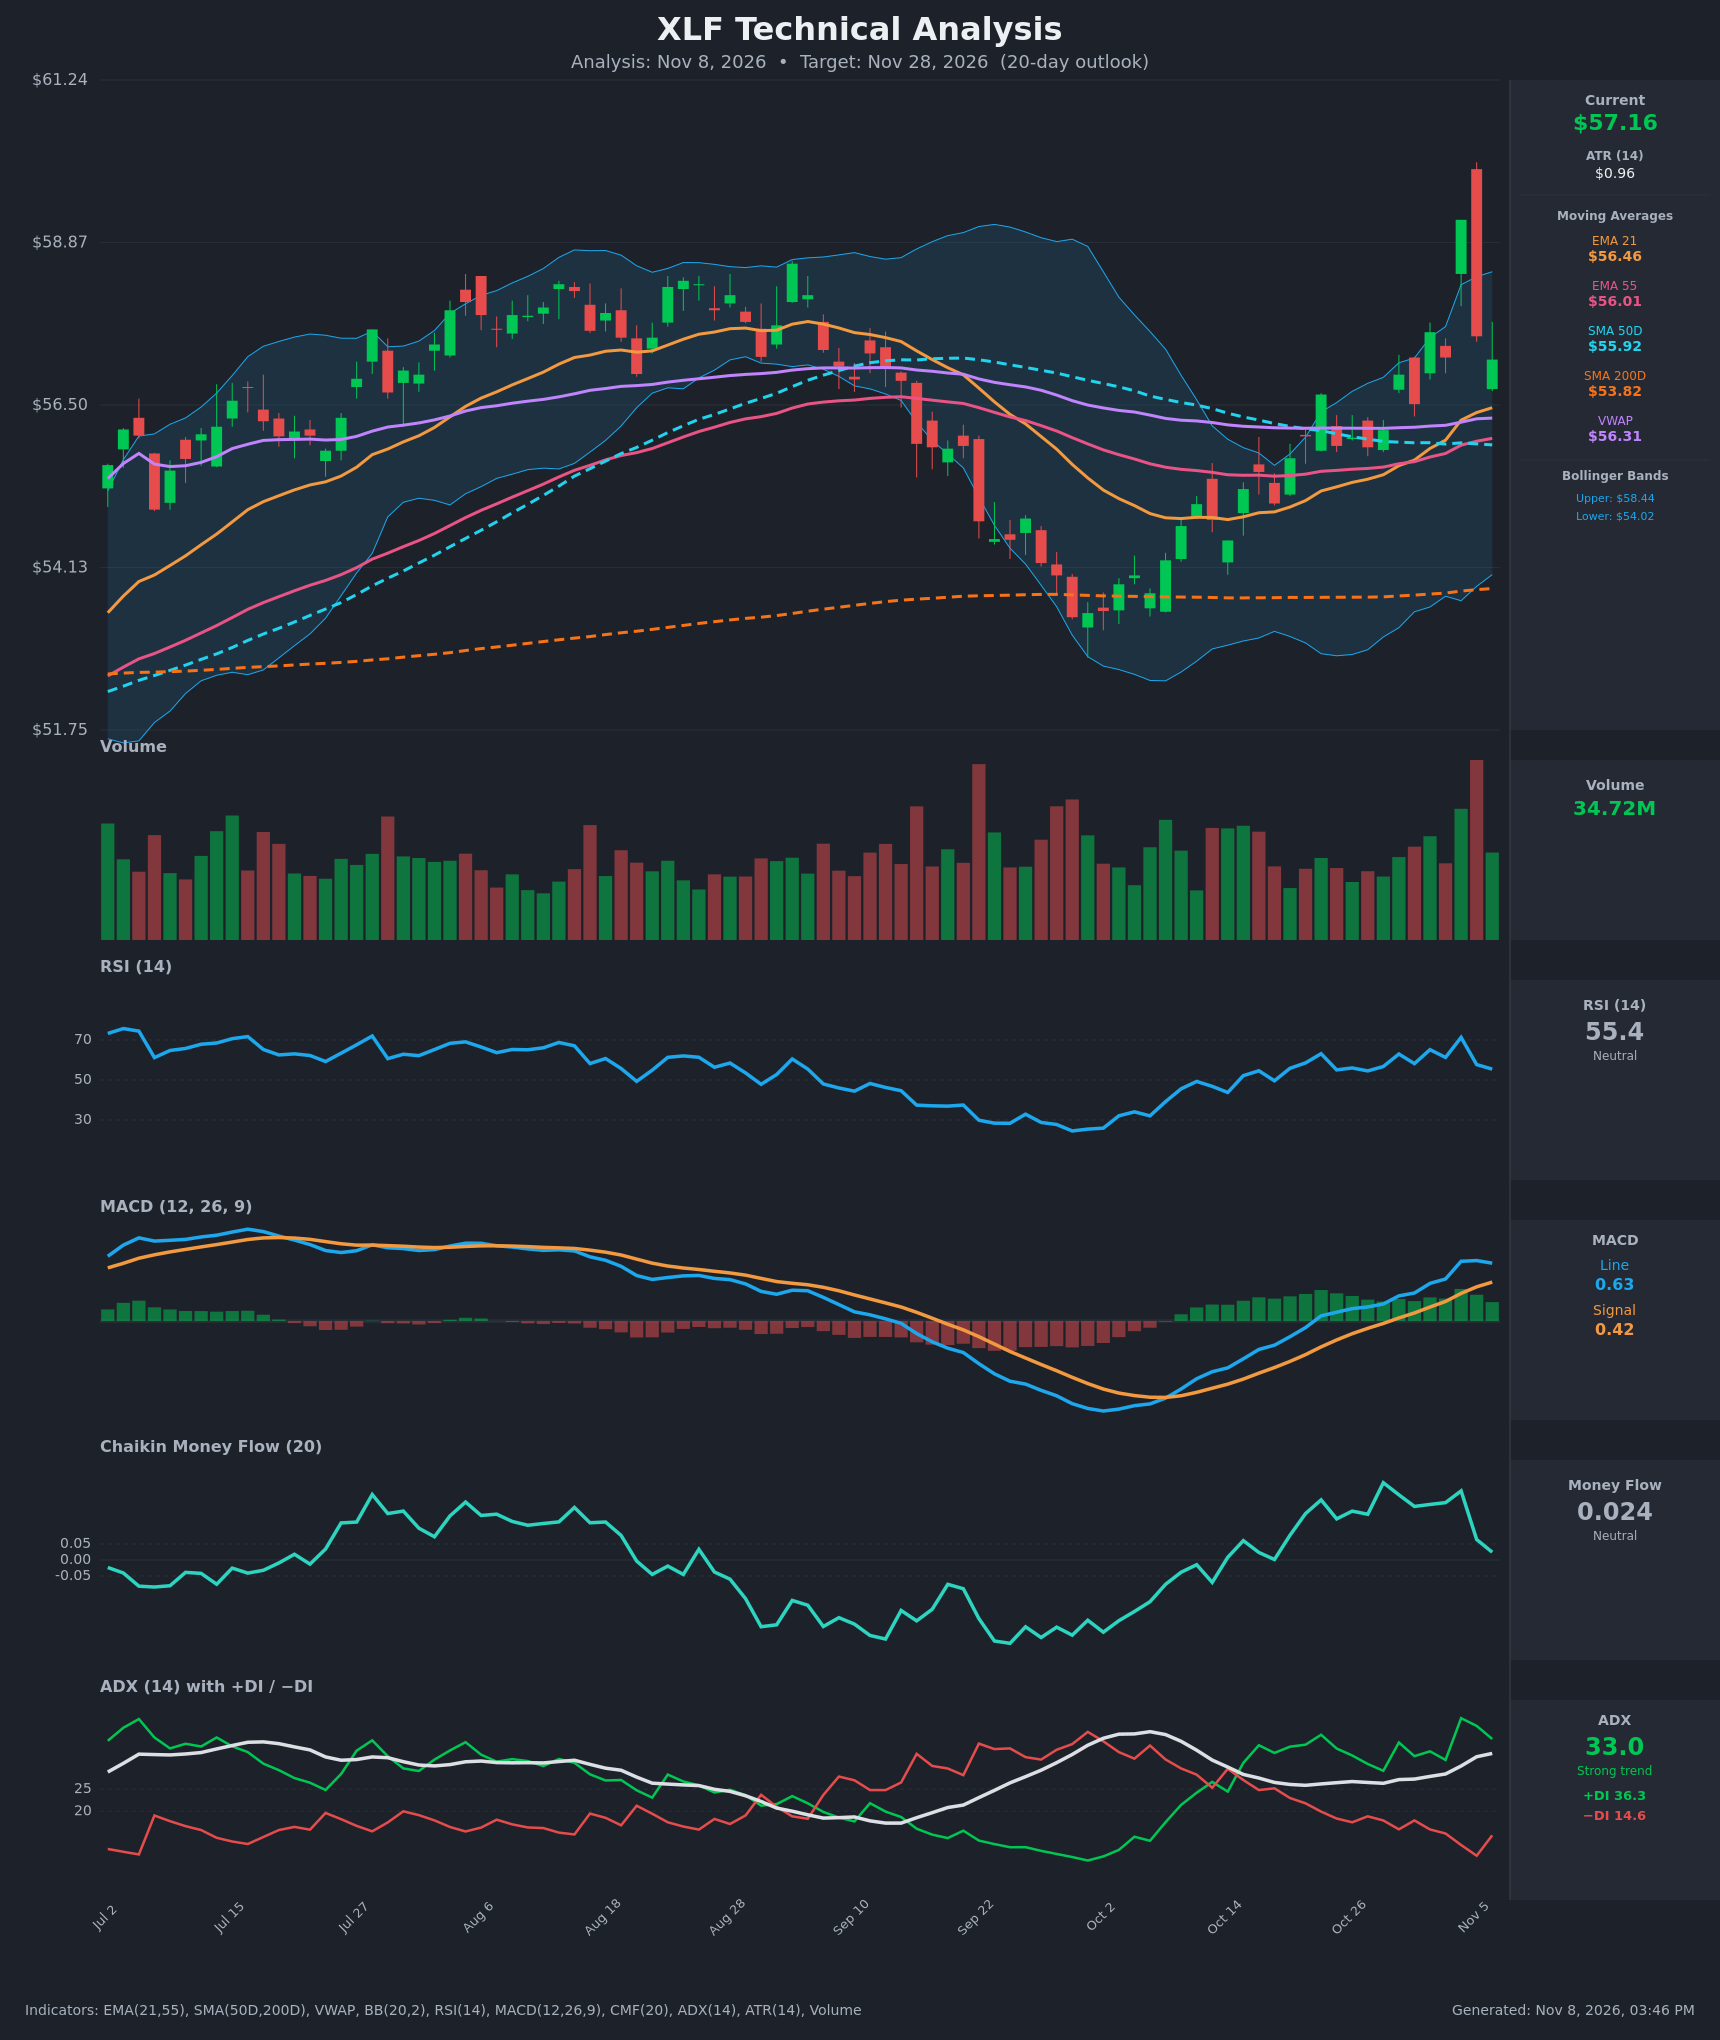
Analysis
TECHNICAL INDICATORS
- RSI (14): 55.43, down from the 71.3 overbought spike on Nov 4 and now back near the midline. Momentum has cooled, but the reading stays above 50 and has not broken down. [Neutral]
- 20 EMA (EMA 21): $56.46, with price at $57.16 about $0.70 above it. EMA21 is above EMA55 ($56.01) after crossing up around Oct 30, and the EMA21 and the 21/55 cluster should act as support on pullbacks. [Bullish]
- MACD: Line 0.631 over signal 0.425, so the bullish crossover (Oct 29) is intact and the line is positive. The histogram is positive at about +0.21, but the line flattened on Nov 5-6 (0.659 → 0.631), so momentum is plateauing. [Bullish]
- Bollinger Bands (20): Upper $58.44, lower $54.02, midline about $56.23. Price is in the upper half of the bands after the Nov 4 spike through the upper band was rejected. The bands are expanding after a squeeze, which supports a developing trend. [Bullish]
- CMF (20): 0.024, inside the neutral zone (±0.05). It fell sharply from about 0.215 on Nov 4, which shows buying pressure fading on the rejection. [Neutral]
- ADX (14): 33.0 and rising, which is a strong trend. +DI at 36.3 is well above −DI at 14.6, so bulls are firmly in control. [Strong Trend – Bullish]
- Volume: 34.72M. The heaviest volume of the period came on the Nov 4 reversal candle, which suggests short-term exhaustion or profit-taking. Volume since has normalized, with no strong distribution days. [Neutral / mild caution]
DIVERGENCES & TRENDS
- Price is above every key average: EMA21 ($56.46), EMA55 ($56.01), SMA50D ($55.92), VWAP ($56.31) and SMA200D ($53.82). The golden cross (SMA50D > SMA200D) is already in place, so the long-term trend is up.
- The MACD bullish crossover on Oct 29 and the +DI/−DI separation (36.3 vs 14.6) confirm trend alignment. ADX has risen from about 26 to 33.
- Minor short-term bearish divergence: RSI peaked at 71.3 and CMF at 0.215 on Nov 4, and both have faded since. The MACD line has flattened, and price failed at $59.20 and closed back below the upper band.
- The Oct 2 low near $53.2 started a clear sequence of higher highs and higher lows, and the recovery from the Sept lows has been V-shaped.
CHART PATTERNS
- Bullish Flag / Pennant (continuation): A tight consolidation around $55-$56.5 from mid to late October preceded the breakout to $59.20. The breakout from that base projects the prior impulse higher, with a measured move toward the $58.5-$60 area.
- Failed spike / retest: The Nov 4 reversal candle (a shooting-star-like rejection) followed by a pullback to $57.16 looks like a retest of the breakout zone rather than a reversal pattern. A hold above about $56.3-$56.5 keeps the bullish structure intact.
- No confirmed bearish reversal pattern (double top or head and shoulders) is present yet. A lower high below $59 followed by a break under $56 would start to build a double-top setup.
POTENTIAL SCENARIOS
- Scenario 1: Bullish Trend Continuation — The pullback holds the EMA21/VWAP support zone and the strong ADX trend resumes, with price retesting the upper Bollinger Band and the Nov 4 high. Trigger: a daily close above $58.00, then above $58.44. Target: $58.00-$59.20, with an extension toward $59.80. Invalidation: a daily close below $56.00. (55% probability)
- Scenario 2: Neutral Consolidation — Price digests the Nov 4 spike between the EMA cluster and the upper band while ADX cools. Trigger: failure to close above $58.44 and holds above $56.30. Target: $56.30-$58.40 range. Invalidation: a close outside that range. (20% probability)
- Scenario 3: Bearish Failed Breakout — The Nov 4 spike proves a blow-off top and fading CMF turns into distribution. Trigger: a close below $56.00 (EMA55/SMA50D) with a MACD signal cross. Target: $55.00, then $54.00-$54.30 near the lower band. Invalidation: a reclaim of $57.60. (25% probability)
PRICE TARGETS
- Target Price: $58.00 (20-day, by about Nov 28)
- Expected Range: $54.20 to $59.80 (width $5.60, about 9.8% of current price, consistent with the 14-21 day guidance)
- Key Levels: Support at $56.31 (VWAP, with EMA21 at $56.46 and EMA55 at $56.01 just beneath), Resistance at $58.44 (upper Bollinger Band, then the $59.20 spike high)
OVERALL BIAS
OVERALL BIAS: BULLISH - Price is above all key moving averages with a golden cross in place, MACD is above signal, and ADX of 33 with +DI far above −DI confirms a strong uptrend. The Nov 4 rejection and fading RSI and CMF argue for a pullback or consolidation first, but the pattern still favors a continuation toward $58.
This is educational analysis and not financial advice.