DELL 27-day bearish forecast — Nov 8, 2026
- Bias: Bearish
- Timeframe: 27 days (made Nov 8, 2026, target date Dec 4, 2026)
- Price at analysis: $328.53
- Price target: $312.00
- Expected range: $286.00 – $343.00
- Result: Pending — graded after the close on Dec 4, 2026
Get a free AI analysis of DELL today
Analysis
TECHNICAL INDICATORS
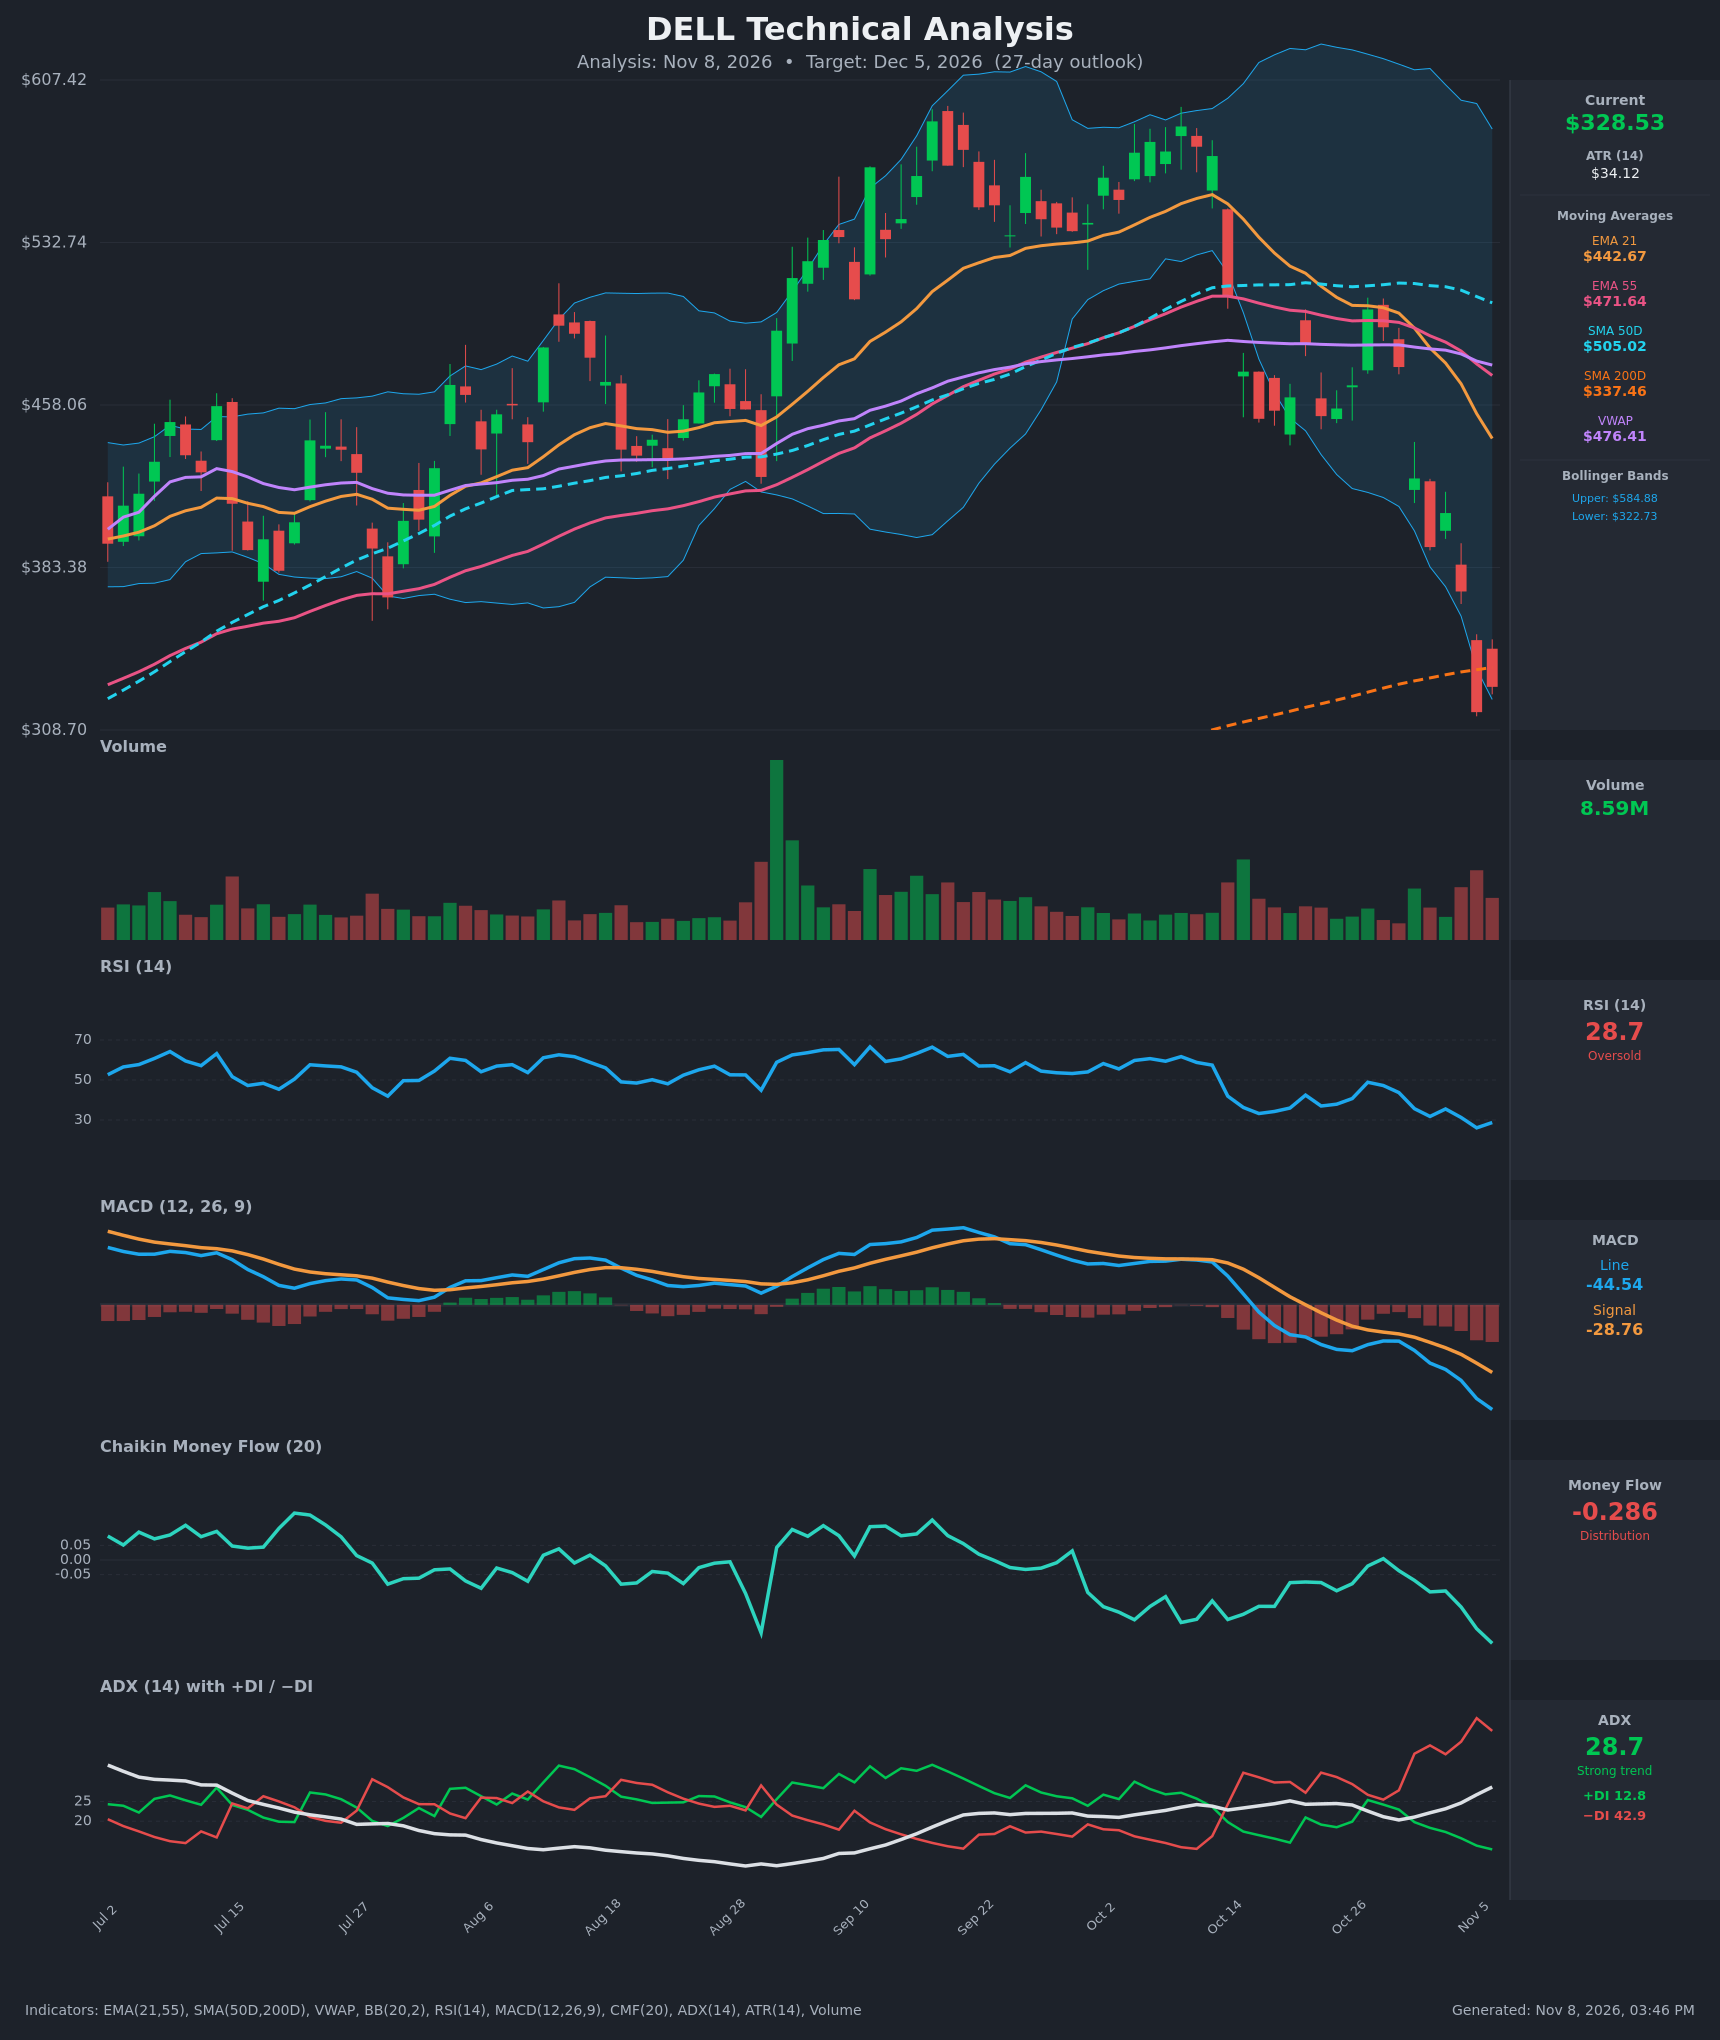
- RSI (14): 28.74, in oversold territory after a slide from the 60s in mid-October. It made a lower low at 26.1 on Nov 5 and only ticked up slightly on Nov 6. Momentum is still pointing down, though a bounce is possible. [Bearish]
- 20 EMA: The chart's short EMA (EMA 21) is $442.67, about 35% above price. EMA 21 is below EMA 55 ($471.64), a bearish cross that occurred around Oct 30. The EMAs are sloping down steeply and act as heavy overhead resistance. [Bearish]
- MACD: The line is -44.54 and the signal is -28.76, so the line is below the signal. The histogram is about -15.8 and widening. The line has accelerated lower, from -8.8 on Oct 19 to -44.5, so bearish momentum is still expanding with no sign of a turn. [Bearish]
- Bollinger Bands (20): Upper is $584.88 and lower is $322.73. Price at $328.53 is hugging the lower band after a band-walk and a volatility expansion. This is stretched, which raises bounce risk, but a band-walk in a strong trend usually persists. [Bearish]
- CMF (20): -0.286, deeply in distribution and at the lowest level on the chart. It has fallen steadily from near 0 in late October, showing persistent, heavy selling pressure. [Distribution]
- ADX (14): 28.7 and rising, above the 25 threshold. −DI at 42.9 is far above +DI at 12.8, so bears are firmly in control. [Strong Trend – Bearish]
- Volume: 8.59M, with the last several red candles on elevated volume (the Nov 5 breakdown candle had some of the heaviest recent volume). The heavy volume on the selloff confirms genuine distribution. It could also signal early capitulation if volume spikes and then fades. [Bearish – confirming selling]
DIVERGENCES & TRENDS
- There is no bullish RSI or MACD divergence. RSI made a lower low (26.1) along with a lower price low, and MACD is making new lows. Momentum is confirming the price decline.
- Price has fallen from about $580 in late September/October to $328, a decline of roughly 43%. It has broken below every moving average except the rising SMA200D.
- Price lost the SMA200D ($337.46) on Nov 5 (close $316.91) and only partially reclaimed the area, closing Nov 6 at $328.53, still below it. This is a major long-term support break.
- SMA50D ($505) is still above SMA200D ($337), so no death cross yet. The gap is wide, and a cross is a distant possibility, not an imminent signal.
- EMA 21 crossed below EMA 55 around Oct 30. MACD crossed bearish around Oct 21–22. The −DI/+DI gap widened to its largest on the chart.
- Price is far below VWAP ($476), which is a sign of sustained selling pressure.
CHART PATTERNS
- Closest reference pattern: A Bearish Head and Shoulders / Double Top style reversal formed over Sep–Oct. The peak near $580–590 was followed by a lower high near $520–$545 in mid-to-late October. The breakdown through the neckline zone around $450–$460 (the Oct 14 gap-down) confirmed the reversal. A measured move from that top points toward the low-to-mid $300s, which price has now reached.
- Possible Bearish Flag/Pennant: The small consolidation in late October ($455–$500) was followed by a continuation breakdown, consistent with a Bearish Flag Pattern.
- Significance: The measured targets are essentially achieved near $310–$330. Further downside needs a break of the recent low (~$309–$317). With no base pattern formed yet (no double bottom or inverted H&S), a bounce would likely be a relief rally into resistance, not a confirmed reversal.
POTENTIAL SCENARIOS
- Scenario 1: Bearish Trend Continuation — Price remains below the SMA200D, the strong downtrend (ADX 28.7, −DI 42.9) persists, and relief rallies are sold at the falling EMAs. Trigger: a daily close below the recent low near $309–$317 on elevated volume. Target: $300–$312, with an extension toward $285–$290 (about 1.5x ATR below the low). Invalidation: a daily close above $360 with a MACD histogram turn. (50% probability)
- Scenario 2: Bullish Oversold Relief Bounce — RSI near 28 and price at the lower Bollinger Band trigger mean-reversion buying, producing a rebound toward the broken SMA200D and the gap area. Trigger: a reclaim of the SMA200D at $337.46 with a rising RSI above 35. Target: $360–$380 (about 1 ATR-multiple bounce toward the gap and the falling EMA 21 area is capped around $380–$400). Invalidation: a close below $309. (35% probability)
- Scenario 3: Neutral Basing Range — A volatile consolidation between roughly $305 and $345 as selling exhausts but there is no catalyst for a reversal. Trigger: several closes between $310 and $345 with falling volume. Target: about $325. Invalidation: a close outside $300–$350. (15% probability)
PRICE TARGETS
- Target Price: $312.00 (27-day, about 5% below the current price)
- Expected Range: $286.00 to $343.00 (width $57, about 17.4% of the current price; this fits the 30–60 day band at the low end given the 27-day horizon)
- Key Levels: Support at $308.70, Resistance at $337.46
OVERALL BIAS
OVERALL BIAS: BEARISH - The trend indicators all align: −DI far above +DI with ADX at 28.7, a widening MACD histogram, CMF in deep distribution, and price below all major averages and the SMA200D. The oversold RSI and the lower-band touch raise the odds of a relief bounce, but a bounce toward $337–$380 would more likely face resistance than mark a bottom.
This is educational analysis and not financial advice.