IBIT 27-day bearish forecast — Nov 8, 2026
- Bias: Bearish
- Timeframe: 27 days (made Nov 8, 2026, target date Dec 4, 2026)
- Price at analysis: $42.88
- Price target: $41.00
- Expected range: $38.40 – $44.80
- Result: Pending — graded after the close on Dec 4, 2026
Get a free AI analysis of IBIT today
Analysis
TECHNICAL INDICATORS
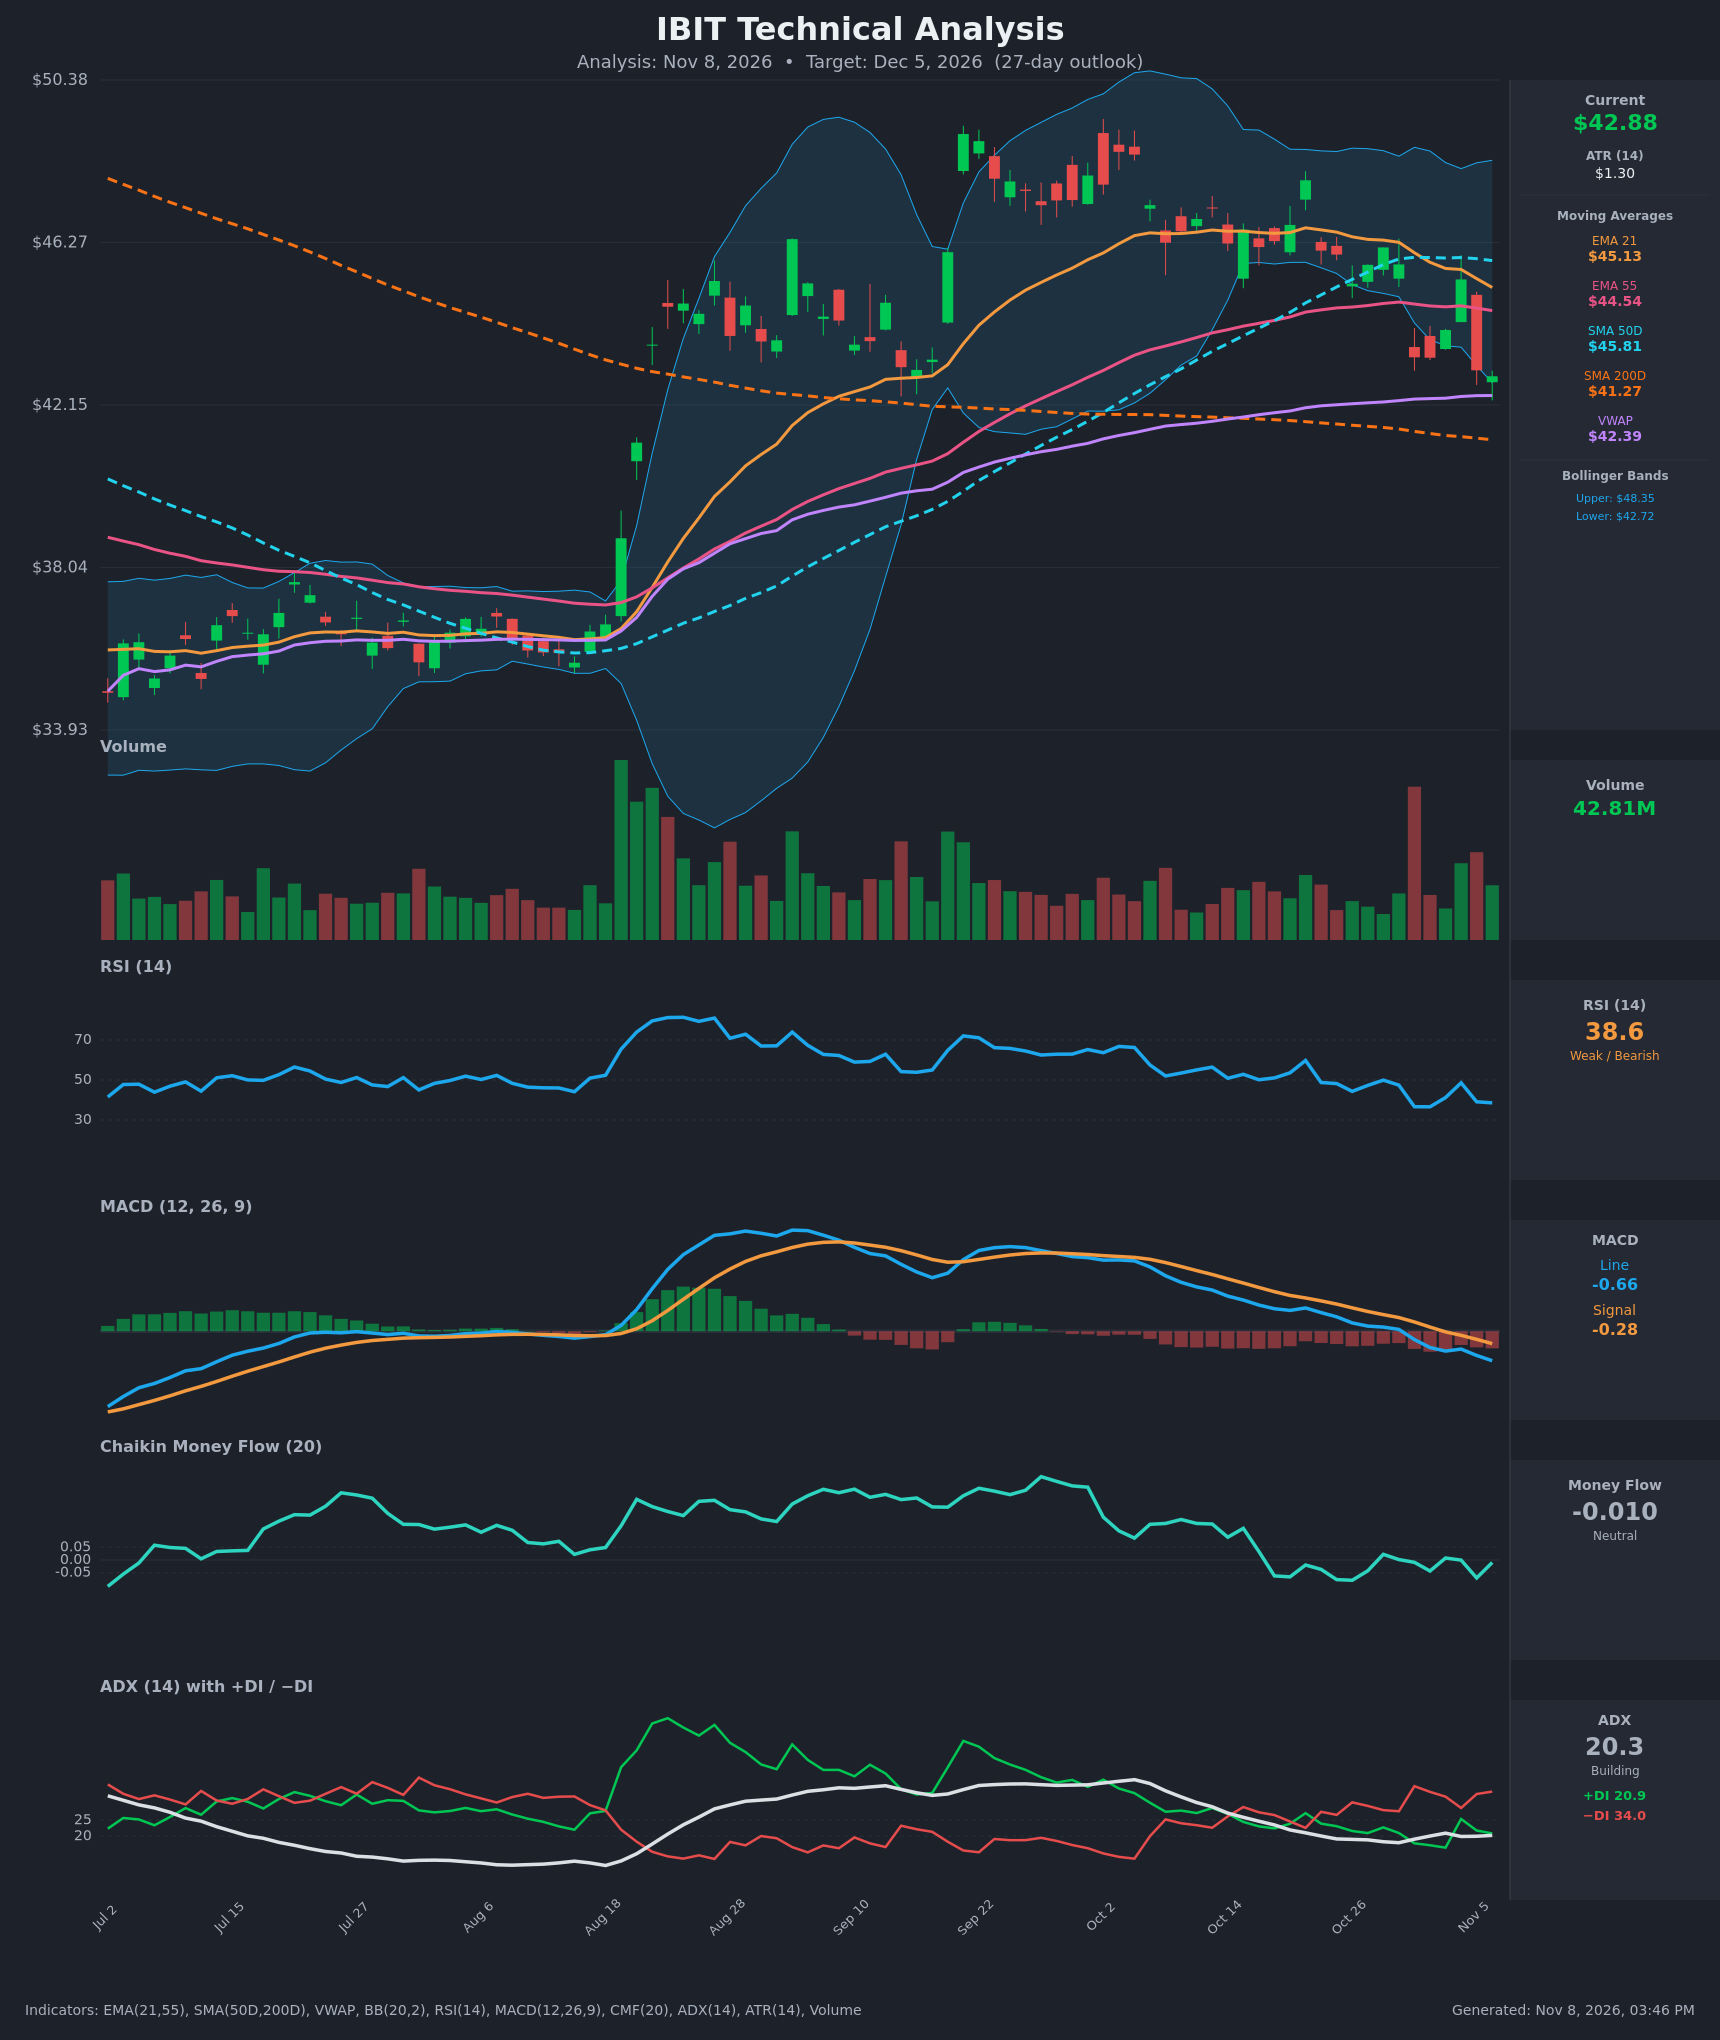
- RSI (14): 38.57, down from ~60 on Oct 21 and just above oversold (30). Momentum is clearly bearish but not yet washed out, so there is room for more downside. [Bearish]
- 20 EMA: EMA 21 is $45.13 and falling, with price ($42.88) about 5% below it. EMA 55 is $44.54 and also overhead. The EMA 21 is converging on the EMA 55 (gap ~$0.59, down from ~$2.2 on Oct 19), so a bearish crossover is close. Both averages now act as resistance. [Bearish]
- MACD: Line -0.663 is below Signal -0.278 and both are negative. The bearish crossover happened around Oct 30–Nov 3, and the histogram is widening negative. [Bearish]
- Bollinger Bands (20): Upper $48.35, lower $42.72. Price at $42.88 is pinned against the lower band, and the bands have started to contract from their September expansion. Tagging the lower band in a downtrend usually signals trend continuation more than reversal, though a short-term snap-back toward the midline (~$45.5) is possible. [Bearish]
- CMF (20): -0.010 is inside the neutral band (±0.05). It has slipped from strongly positive in September and hovers near zero, so buyers have faded without heavy distribution yet. [Neutral]
- ADX (14): 20.3, borderline between weak and developing. −DI (34.0) is well above +DI (20.9), and the bears have held that lead since Oct 22 (apart from one brief flip on Nov 4). ADX has ticked up from 18 as the selling picked up. [Weak Trend, Bearish Direction]
- Volume: 42.81M, around average. Down days (Oct 30 gap, Nov 5) came with elevated volume, and one very large red volume bar appeared in late Oct. Heavier selling than buying is slightly bearish. [Mildly Bearish]
DIVERGENCES & TRENDS
- No clear bullish divergence. RSI (38.6) is making lower lows along with price and has not yet reached oversold, so there is no sign of seller exhaustion.
- Price has lost the EMA 21, EMA 55 and SMA 50D ($45.81). The SMA 50D has flattened and is rolling over.
- Price remains above the SMA 200D ($41.27) and VWAP ($42.39). Both are close below and are the last supports before a deeper decline. The golden cross (SMA 50D above SMA 200D) is already in place, so the long-term structure is intact but weakening.
- The MACD bearish crossover and the −DI dominance both confirm a momentum shift down from the October highs.
- CMF has fallen from the September peak to near zero, showing fading accumulation.
CHART PATTERNS
- Bearish Double Top (with a loose Triple Top flavour): Highs near $47.84 (Oct 21) and the ~$48 area in September and early October formed a ceiling. The neckline is the ~$43.0–43.4 lows from Oct 30, Nov 2 and Nov 5. Price at $42.88 is now at or just through that neckline. The measured move is the pattern height ($47.84 − $43.00 ≈ $4.84) projected down, giving roughly $38.2.
- The lower highs and the loss of all short-term moving averages also resemble a Bearish Flag/Pennant break after the sharp Oct 30 drop. The $41.27–$42.39 zone (SMA 200D and VWAP) is the key test.
POTENTIAL SCENARIOS
- Scenario 1: Bearish Neckline Breakdown — Price closes below the $43 neckline and VWAP, then tests and breaks the SMA 200D, heading toward the double-top measured move. Trigger: daily close below $42.39 with volume expansion and the EMA 21/55 bearish cross. Target: $41.27 first, then $39–$38.50. Invalidation: daily close back above $45.13 (EMA 21). (55% probability)
- Scenario 2: Bullish Oversold Bounce — Price holds the lower Bollinger Band and SMA 200D/VWAP zone and squeezes back toward the EMA cluster. Trigger: RSI turning up from the high 30s and a reclaim of $44.50. Target: $45.1–$45.8 (EMA 21 / SMA 50D). Invalidation: close below $41.27. (28% probability)
- Scenario 3: Neutral Chop at Support — Price oscillates between SMA 200D support and EMA 55 resistance as ADX stays near 20. Trigger: failure to break either $41.27 or $44.50. Target: $41.5–$44.5. Invalidation: decisive close outside that band. (17% probability)
PRICE TARGETS
- Target Price: $41.00 (27-day horizon, roughly the SMA 200D area, with downside risk toward $38.50 if the double-top measured move plays out)
- Expected Range: $38.40 to $44.80 (width $6.40 ≈ 14.9% of the current price, consistent with the 12–18% guide for 30–60 days scaled to 27 days)
- Key Levels: Support at $41.27 (SMA 200D, with VWAP at $42.39 as the first minor floor), Resistance at $45.13 (EMA 21, with EMA 55 at $44.54 as the first minor ceiling)
OVERALL BIAS
OVERALL BIAS: BEARISH - Price has lost every short-term moving average and sits on the lower Bollinger Band. The MACD bearish crossover, −DI dominance (34.0 vs 20.9) and a probable double-top neckline break all point lower, with the SMA 200D (~$41.27) as the first major test. Conviction is moderate because ADX is only ~20 and RSI is not yet oversold.
This is educational analysis and not financial advice.