HOOD 27-day bearish forecast — Nov 8, 2026
- Bias: Bearish
- Timeframe: 27 days (made Nov 8, 2026, target date Dec 4, 2026)
- Price at analysis: $80.91
- Price target: $77.00
- Expected range: $70.50 – $85.00
- Result: Pending — graded after the close on Dec 4, 2026
Get a free AI analysis of HOOD today
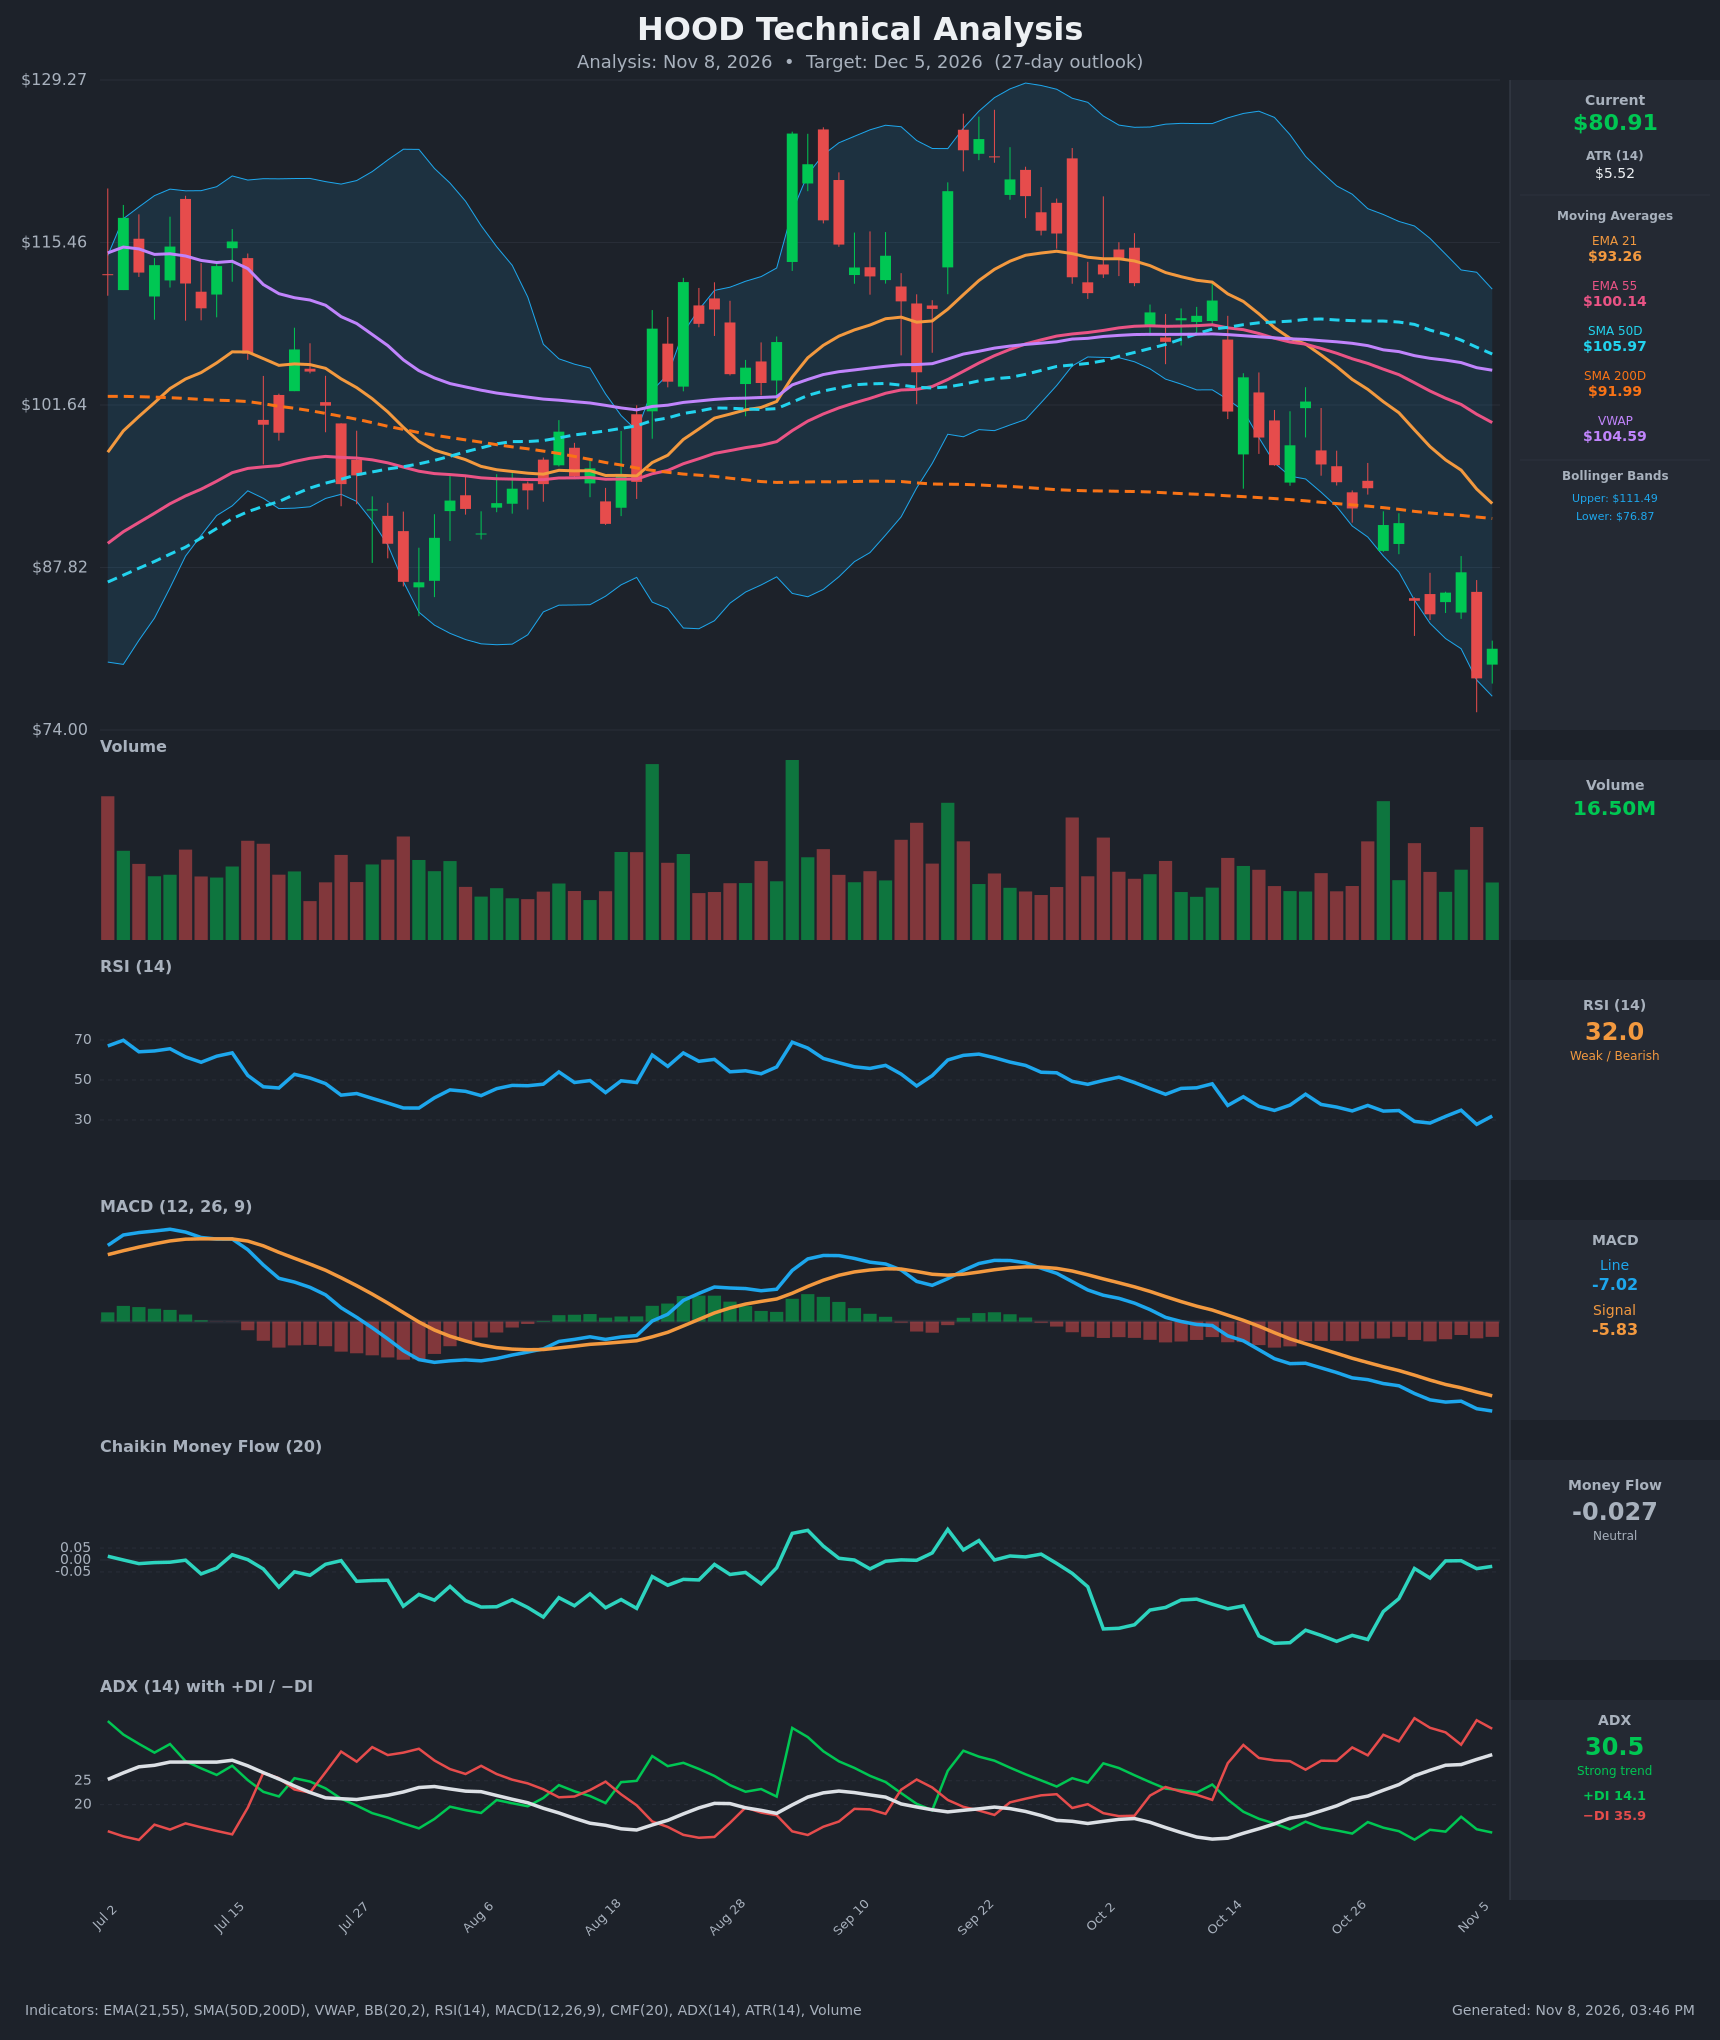
Analysis
TECHNICAL INDICATORS
- RSI (14): 31.97, just above the oversold line of 30. It touched 27.8 on Nov 5 and has been below 40 for most of the past three weeks. Momentum is weak, though the reading is stretched enough to allow a relief bounce. [Bearish]
- 20 EMA: The supplied value is the EMA 21 at $93.26, about 15% above price and falling steeply (from $108.22 on Oct 19). It sits below the EMA 55 ($100.14), and the bearish cross occurred around Oct 22. The EMA 21 is overhead resistance. [Bearish]
- MACD: Line at -7.02 is below the signal at -5.83, and the gap is widening. The histogram is negative and has deepened since the Oct 28 low, so there has been no bullish crossover. Downside momentum is intact. [Bearish]
- Bollinger Bands (20): Price at $80.91 is in the lower quarter of the bands ($76.87 lower, $111.49 upper). It is hugging the lower band after a wick toward $74. The bands are wide and the lower band is still sloping down, which points to a trend walk rather than a squeeze. [Bearish]
- CMF (20): -0.027 is neutral, between -0.05 and +0.05. It has recovered from -0.35 in mid-October, so selling pressure has faded even as price fell. [Neutral]
- ADX (14): 30.5 and rising, a strong trend. −DI (35.9) is far above +DI (14.1), so bears are firmly in control. [Strong Trend – Bearish]
- Volume: 16.50M on the latest bar, in line with recent averages. The Nov 5 capitulation-style red bar had heavy volume, followed by a small green bounce candle. There is no clear volume climax yet. [Neutral / mildly bearish]
Other trend context from the data:
- Price is below the SMA200D ($91.99), the SMA50D ($105.97) and VWAP ($104.59). All of them are overhead resistance.
- The SMA50D is converging toward the SMA200D, a possible death cross in coming weeks.
DIVERGENCES & TRENDS
- Mild bullish divergence: Price made a lower low on Nov 5 ($78.39) and then $80.91, against $83.84 on Nov 2. RSI's low of 27.8 is only marginally below its 28.5 low, and CMF has risen from -0.35 to about -0.03. Selling pressure is easing, but this is not a confirmed reversal.
- No MACD divergence: The MACD is making new lows with price, which confirms the downtrend.
- Trend: The EMA 21 crossed below the EMA 55 around Oct 22. ADX has climbed from 16 to 30.5 while −DI stays above 30, which describes a maturing but healthy downtrend.
- Distance from the EMA 21: Price is roughly 13% below it. That is stretched and raises the odds of a snap-back rally to $85–$88 before the next leg down.
CHART PATTERNS
- Double/triple top near $125 (Sep–Oct): Highs around $125 formed repeated peaks, then price broke the ~$103 neckline in mid-October. The measured move is about $22 ($125 − $103), giving a target near $81. That target has essentially been reached, so this pattern's downside is largely exhausted.
- Bearish continuation structure: Price is making lower highs and lower lows below falling EMAs, a descending channel. Rallies toward the EMA 21 ($93) would be sell-the-rip zones.
- Possible base: The long lower wick near $74 and the small green candle on Nov 6 hint at an attempt to base. A falling wedge or double bottom would need a higher low and a close above ~$87.4, and neither is confirmed.
POTENTIAL SCENARIOS
- Scenario 1: Bearish Trend Continuation — Price rallies weakly toward $85–$87, fails below the falling EMA 21, and then re-tests and breaks the $74–$76 area. Trigger: rejection at $85–$87 or a close below $76.87 (lower Bollinger Band) with −DI staying above 30. Target: $74 first, then $70–$72. Invalidation: daily close above $93.26 (EMA 21). (50% probability)
- Scenario 2: Bullish Oversold Relief Bounce — The measured-move target is met, RSI turns up from oversold, CMF turns positive, and price mean-reverts toward the EMA 21. Trigger: close above $87.41 with a MACD histogram turning up. Target: $93–$95 (EMA 21 and SMA200D zone). Invalidation: close below $74. (35% probability)
- Scenario 3: Neutral Basing Range — Price chops between roughly $74 and $88 as selling exhausts and the trend slows, with ADX fading. Trigger: ADX rolling over below 25 and repeated defended lows near $76–$78. Target: $78–$84. Invalidation: close outside $73–$89. (15% probability)
PRICE TARGETS
Range width check: $85.00 − $70.50 = $14.50, or about 17.9% of $80.91, which fits the 12–18% guidance for 27 days.
- Target Price: $77.00 (27 days)
- Expected Range: $70.50 to $85.00
- Key Levels: Support at $74.00, Resistance at $87.40
OVERALL BIAS
OVERALL BIAS: BEARISH - ADX of 30.5 with −DI (35.9) dominating, a widening negative MACD, price below every major moving average, and a bearish EMA cross all favor continued downside. The oversold RSI and improving CMF suggest any decline may be shallow and a relief bounce toward $85–$87 is likely along the way. The double-top measured target is also already met, so conviction is modest.
This is educational analysis and not financial advice.