GOOGL 27-day bearish forecast — Nov 8, 2026
- Bias: Bearish
- Timeframe: 27 days (made Nov 8, 2026, target date Dec 4, 2026)
- Price at analysis: $284.78
- Price target: $274.00
- Expected range: $254.00 – $297.00
- Result: Pending — graded after the close on Dec 4, 2026
Get a free AI analysis of GOOGL today
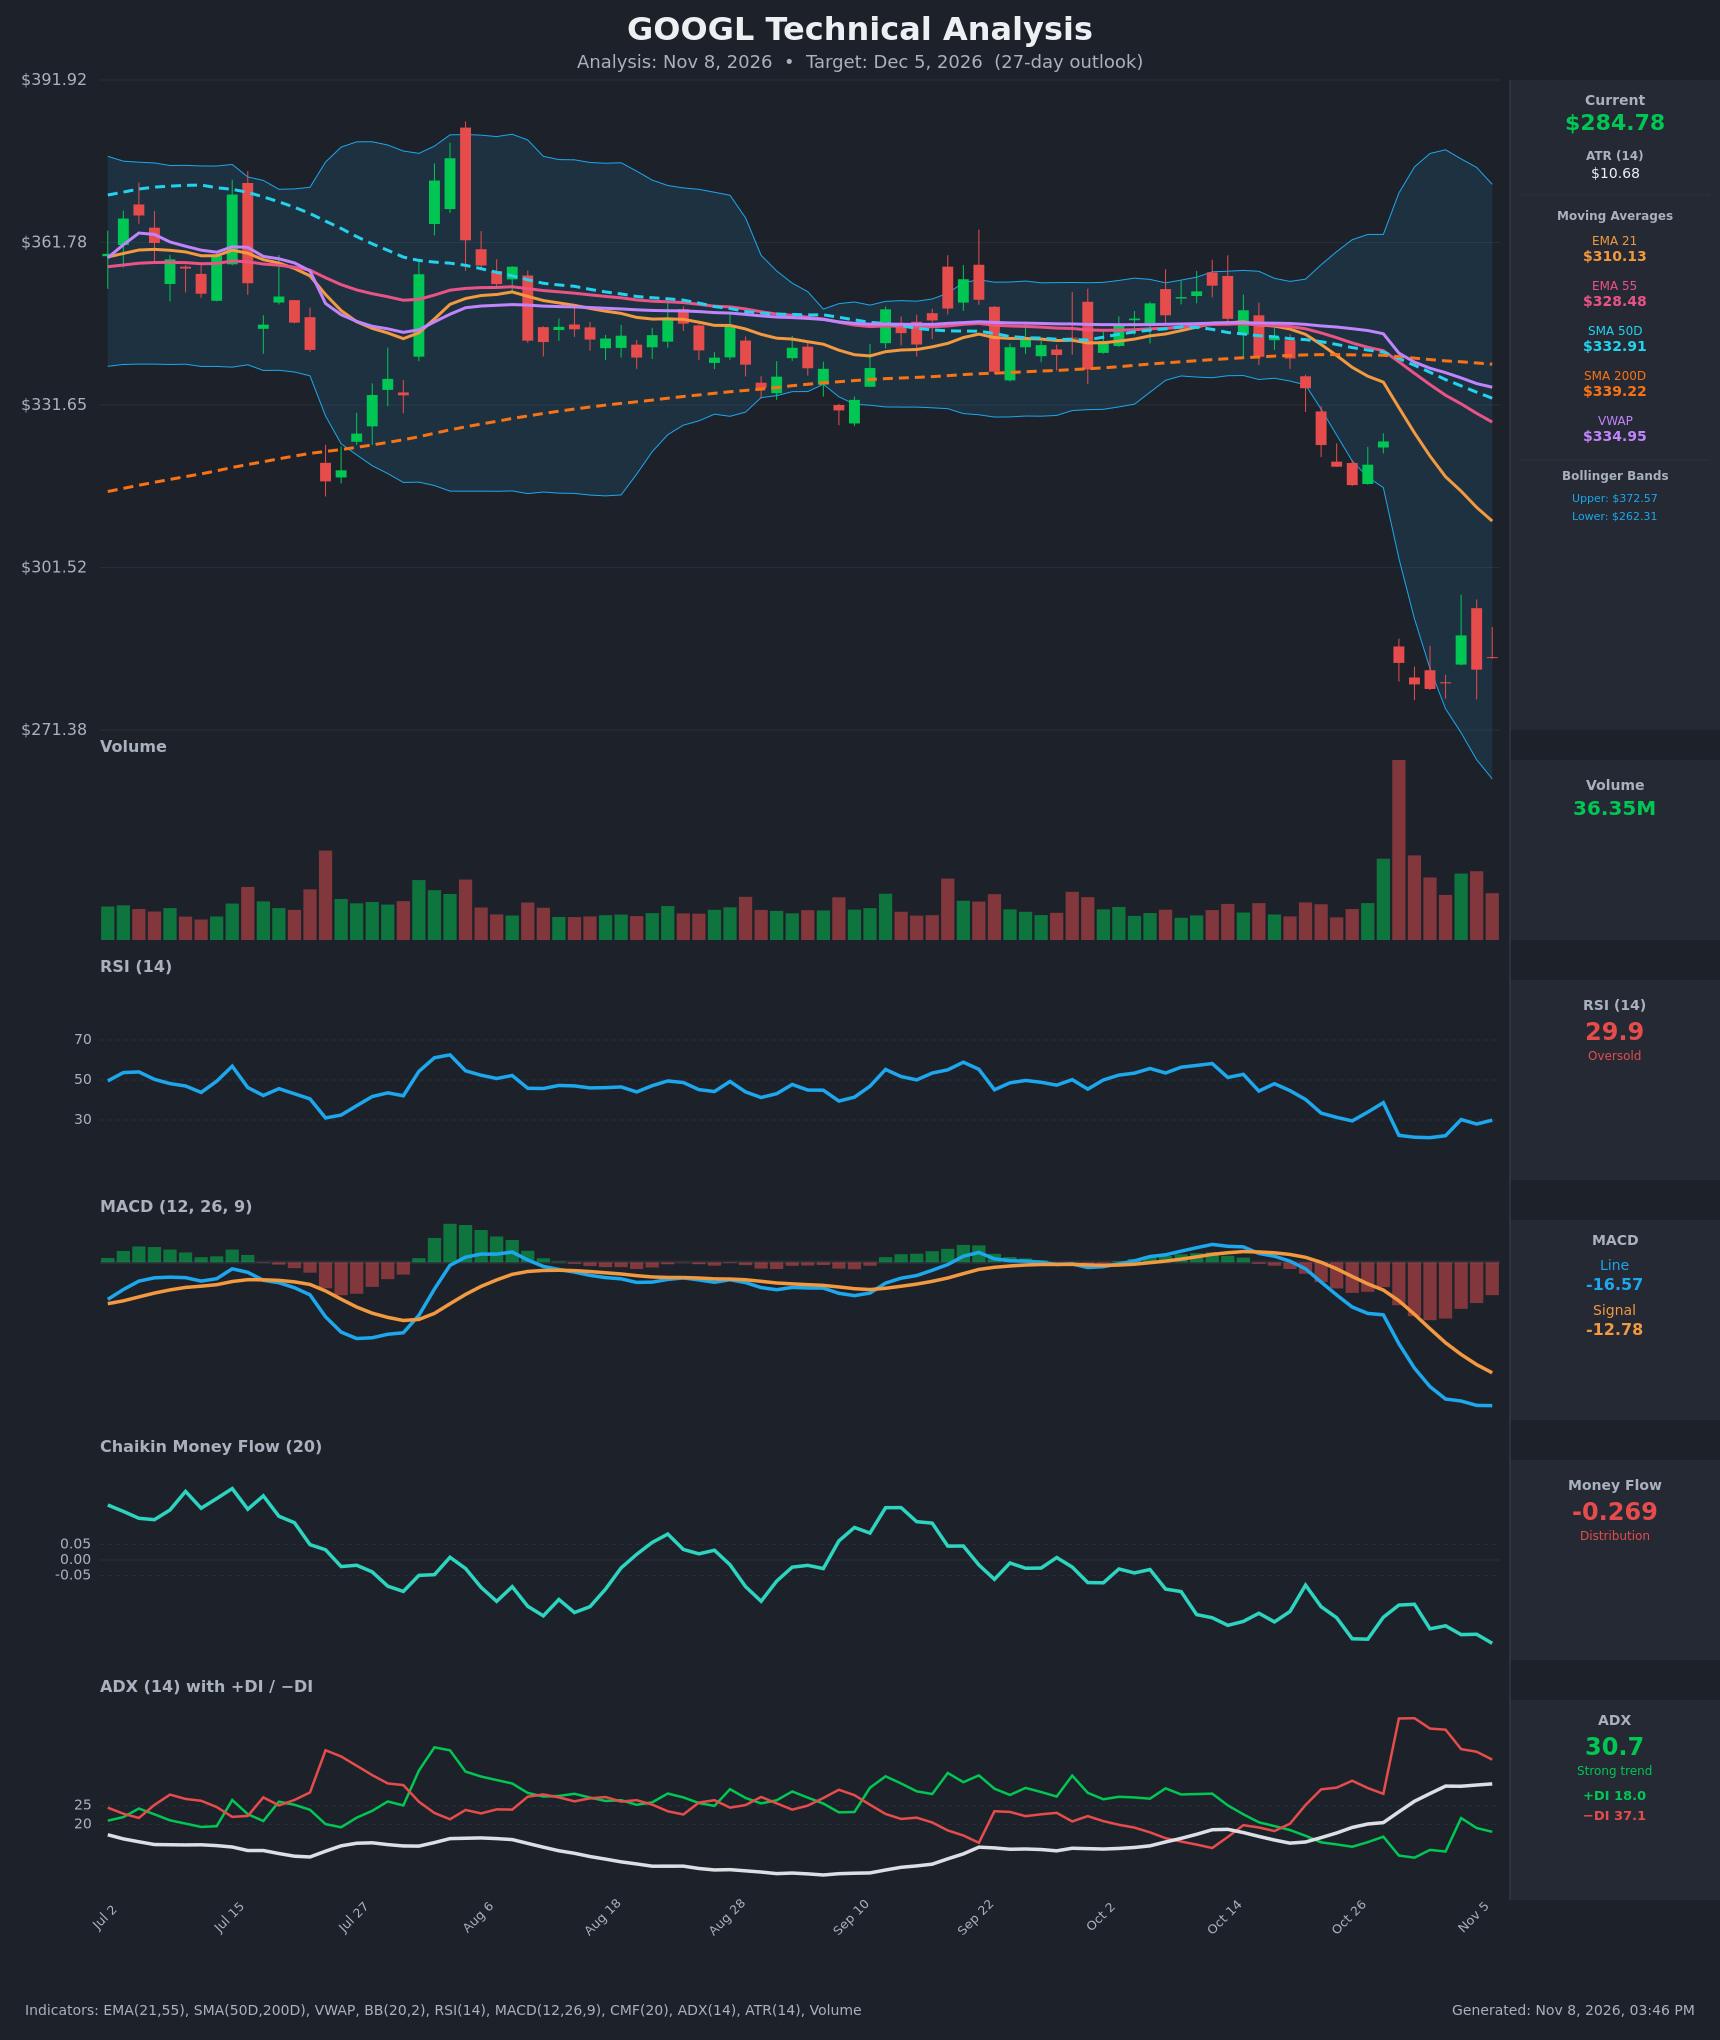
Analysis
TECHNICAL INDICATORS
- RSI (14): 29.92, just under the oversold line. It has bounced from 21.2 on Nov 2 but is still below 30, and the chart shows it capped under 40 since the gap. A relief bounce is building, but momentum has not turned. [Neutral]
- 20 EMA (data shows EMA 21): $310.13, with price ($284.78) about 8.2% below it. The EMA has been falling steadily from $346 and sits below the EMA 55 ($328.48), which crossed bearishly around Oct 19-20. It is now overhead resistance. [Bearish]
- MACD: Line -16.57 is below signal -12.78, with a negative and widening histogram. The bearish crossover came on Oct 21. The line is now flattening (-16.54 to -16.57), so downside momentum is slowing but has not reversed. [Bearish]
- Bollinger Bands (20): Upper $372.57, lower $262.31, and the bands are very wide after the gap. Price is in the lower third of the bands, about $22 above the lower band. It is not a squeeze, and the volatility expansion favors the downside. [Bearish]
- CMF (20): -0.269, deep in distribution, and it is still making new lows even as price stabilizes. Sellers are not yet exhausted. [Distribution]
- ADX (14): 30.7 and rising, with -DI (37.1) far above +DI (18.0). The bearish DI crossover came on Oct 21, and ADX has since moved above 25. This is a strong downtrend. [Strong Trend – Bearish]
- Volume: 36.35M, well below the huge spike on the Oct 29 gap-down day. The sell-off was heavy, and the post-gap bounces came on lighter, mixed volume. Recent down bars still carry as much volume as up bars. [Bearish with fading selling pressure]
DIVERGENCES & TRENDS
- Moving averages: Price is below the EMA 21, EMA 55, SMA 50D ($332.91), SMA 200D ($339.22) and VWAP ($334.95). The SMA 50D/SMA 200D death cross occurred around Oct 28-29. The EMA 21 is also below the EMA 55. This is a fully bearish stack.
- RSI: It made a low of 21.2 and is recovering, so selling momentum is easing. This is not a true bullish divergence, because price has not made a lower low against a higher RSI low. A bounce toward 40-45 RSI is plausible.
- CMF: It is trending lower, which is a bearish divergence against the modest price stabilization. Money flow is not confirming the bounce.
- Price action: The Oct 29 gap-down (-12.6%) was followed by a base at $279-$289. Each bounce (Nov 4 at $288.93) has failed, producing lower highs on the daily relief rally.
- Crossovers: The bearish MACD cross, DI cross, EMA cross and death cross have all occurred, and none have reversed.
CHART PATTERNS
- Bearish continuation (flag/pennant-type consolidation after a gap): Price is consolidating in a $279-$289 range after a sharp drop. A break below $279 would project a measured move toward the $262 lower Bollinger Band and possibly lower, which is the first target.
- Possible Bullish Double Bottom: Lows at roughly $279-$280 (Oct 30 / Nov 2 / Nov 3) with a neckline near $289. A close above $289 on volume would activate it, with a target near $298-$300. It is currently a minor, unconfirmed counter-pattern.
- Gap overhead: The Oct 29 gap leaves resistance in the $316-$325 area, which should cap any rally.
POTENTIAL SCENARIOS
- Scenario 1: Bearish Continuation Lower — The base fails and price rolls over in line with the strong ADX/-DI trend and persistent distribution. Trigger: daily close below $279 on rising volume. Target: $262 (lower Bollinger Band), with an extension toward $255. Invalidation: daily close above $296 (a break of the lower-high structure). (50% probability)
- Scenario 2: Bullish Oversold Relief Rally — RSI recovers, the double bottom completes and price mean-reverts toward the EMA 21. Trigger: close above $289 with volume expansion. Target: $300-$310 (EMA 21 area). Invalidation: close back below $279. (35% probability)
- Scenario 3: Neutral Range Chop — Price grinds sideways in the post-gap base while indicators reset. Trigger: failure to break either $279 or $289 for several sessions. Target: $279-$292. Invalidation: a decisive close outside that range. (15% probability)
PRICE TARGETS
- Target Price: $274.00 (27-day horizon)
- Expected Range: $254.00 to $297.00 (width $43, about 15.1% of the current price, consistent with the 12-18% guidance for 30-60 days scaled to 27 days)
- Key Levels: Support at $279.00, Resistance at $289.00 (a close above this opens $310)
OVERALL BIAS
OVERALL BIAS: BEARISH - A strong ADX of 30.7 with -DI far above +DI, a bearish MACD, deep CMF distribution, and price below every major moving average (including a completed death cross) outweigh the oversold RSI. Relief bounces have failed at lower highs, so a break of the $279 base is the most likely path toward $262 or lower.
This is educational analysis and not financial advice.