IBM 27-day bearish forecast — Nov 8, 2026
- Bias: Bearish
- Timeframe: 27 days (made Nov 8, 2026, target date Dec 4, 2026)
- Price at analysis: $245.00
- Price target: $239.00
- Expected range: $222.00 – $258.00
- Result: Pending — graded after the close on Dec 4, 2026
Get a free AI analysis of IBM today
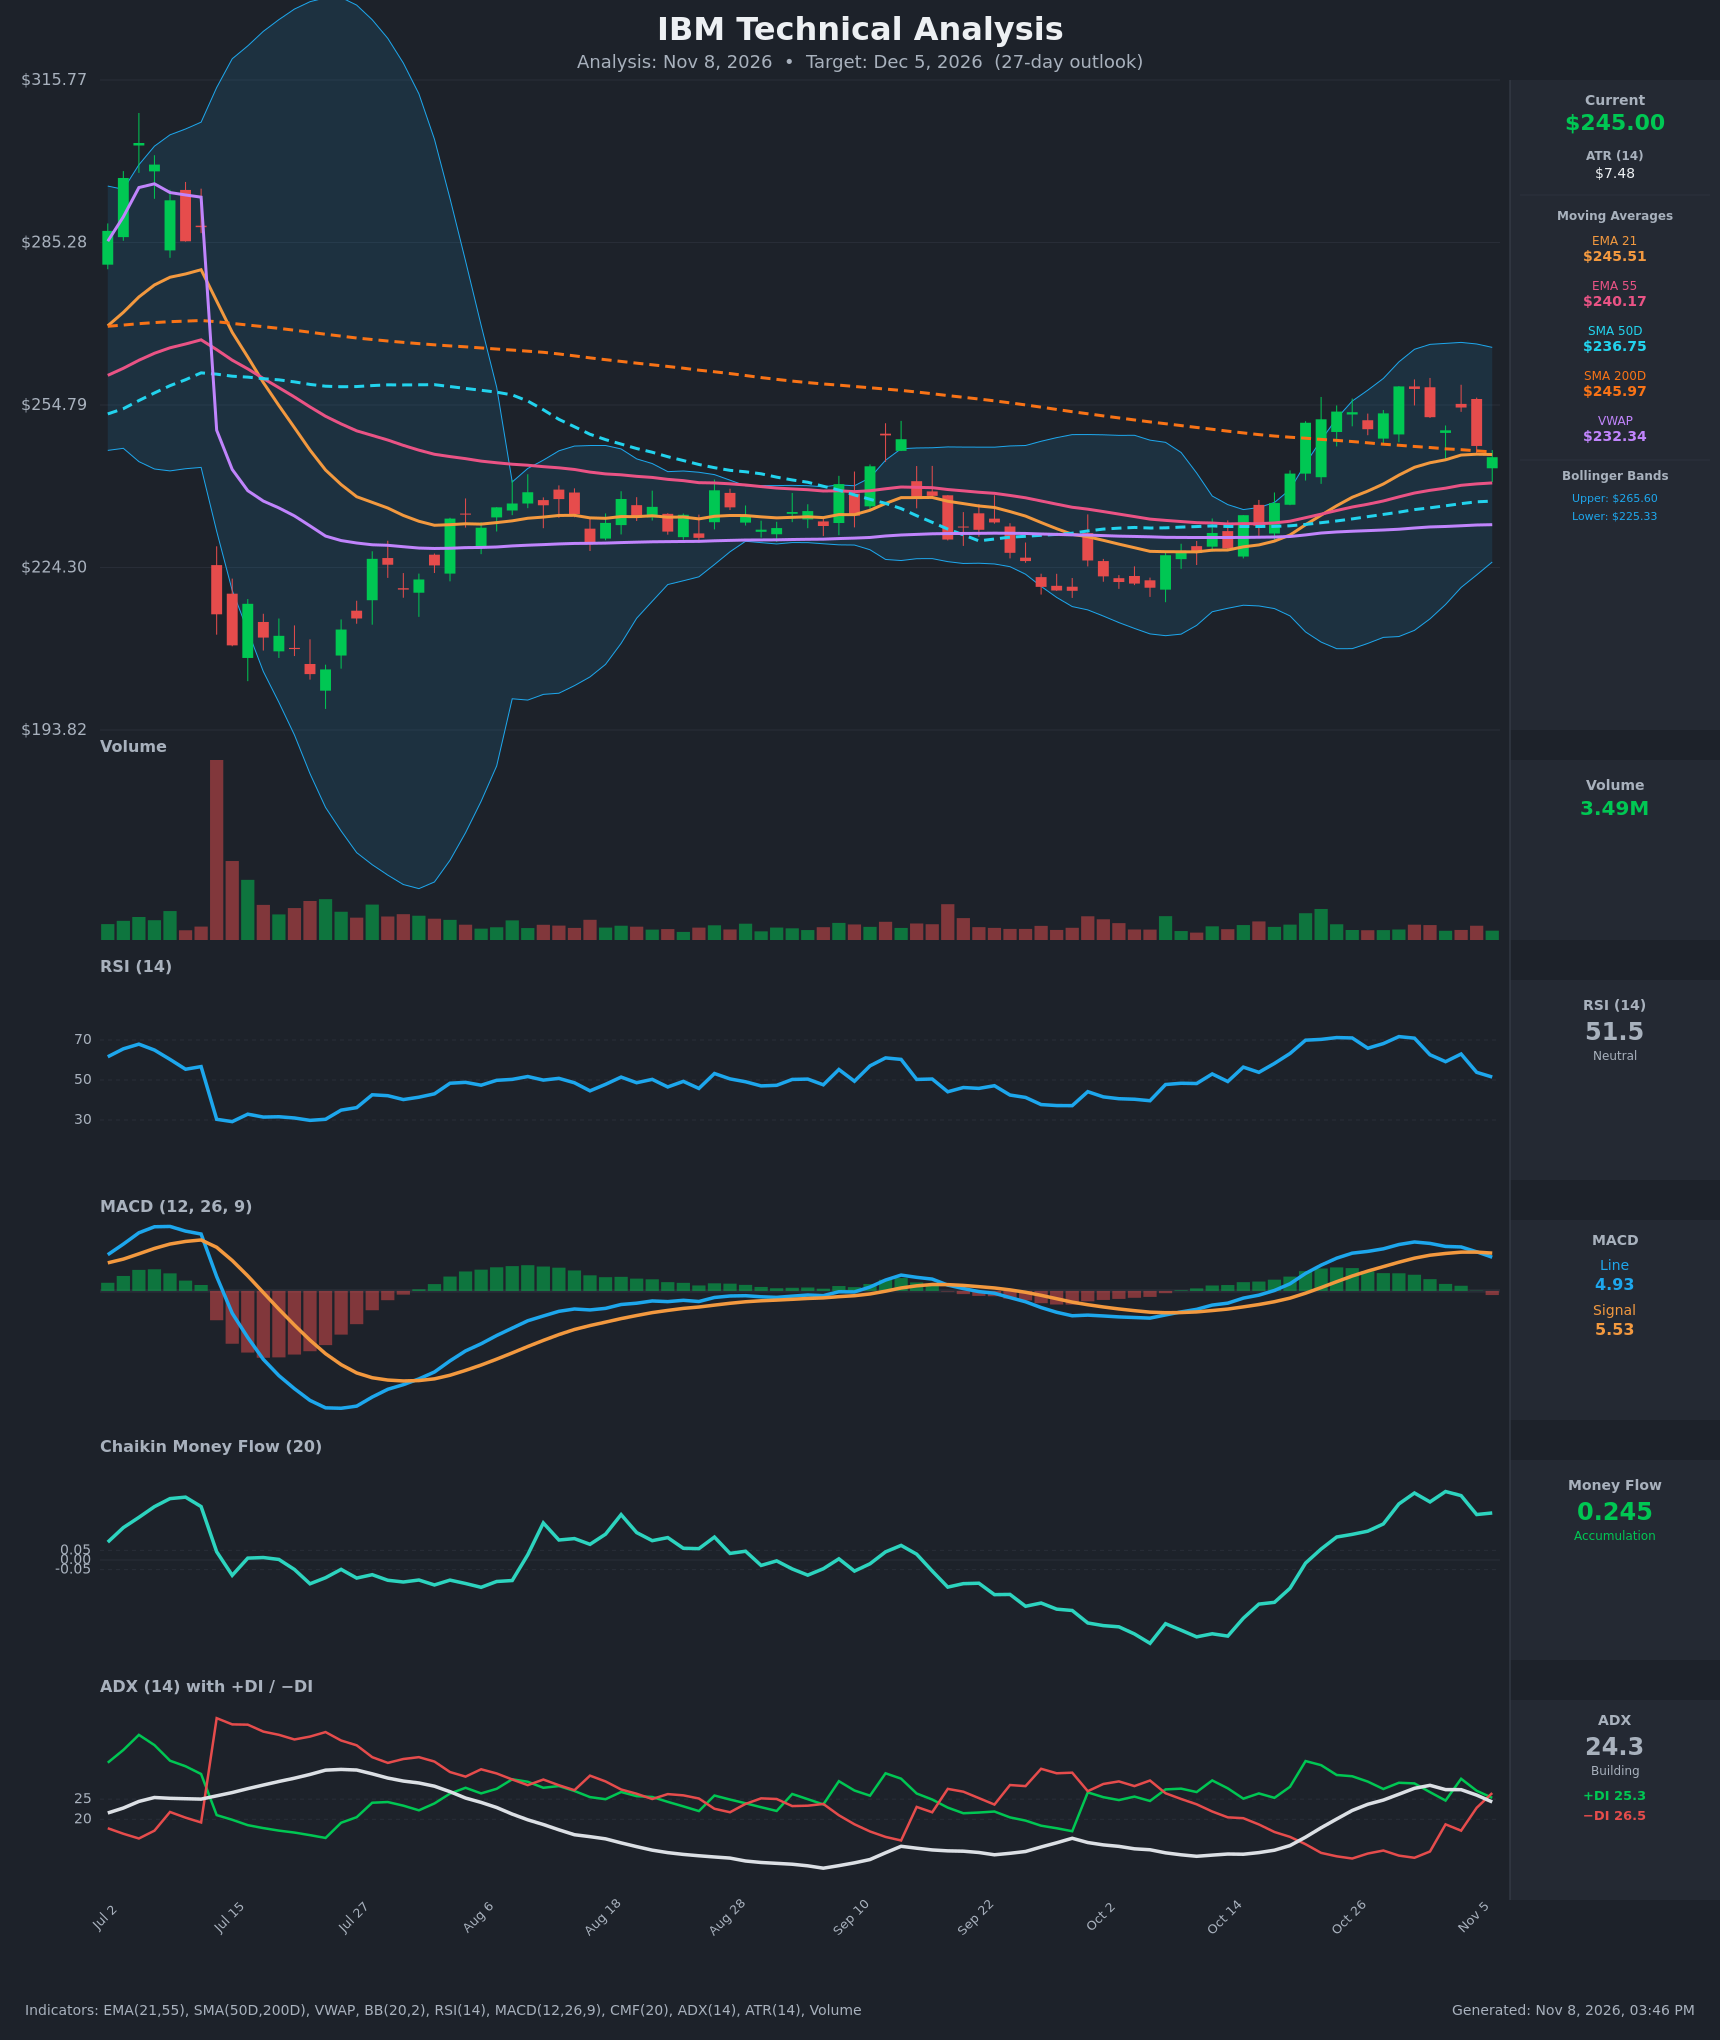
Analysis
TECHNICAL INDICATORS
- RSI (14): 51.5, down sharply from the 71 overbought peak on Oct 23-29 (62.6 on Nov 2, 53.8 on Nov 5). Momentum has fully reset to the midline and is still sloping down. [Neutral]
- 20 EMA (EMA 21): $245.51. Price at $245.00 closed just below it for the first time since Oct 19, so it now acts as resistance. EMA 21 is still above EMA 55 ($240.17), so the broader trend structure is intact. [Bearish]
- MACD: Line 4.93 vs Signal 5.53. The line crossed below the signal on Nov 6 (5.72 vs 5.68 on Nov 5, then 4.93 vs 5.53). The histogram has turned negative and the line has been falling from its 7.16 peak on Oct 30. [Bearish]
- Bollinger Bands (20): Upper $265.60, lower $225.33, midline about $245.5. Price sits on the midline after failing to reach the upper band. The bands are wide (about 16% of price), so volatility is elevated. The midline is acting as a pivot. [Neutral]
- CMF (20): +0.245, well above +0.05. It is still in accumulation but has eased from 0.357 on Nov 3, so buying pressure is fading slightly. This is the main bullish offset. [Accumulation]
- ADX (14): 24.3, falling from 28.4. −DI (26.5) has crossed above +DI (25.3), a bearish DI crossover. The trend is weakening and has turned slightly toward sellers. [Weak Trend, bearish tilt]
- Volume: 3.49M, modest compared with the earlier spike days. There is no strong volume follow-through on the pullback or on the rally. The recent red candles show mild distribution without conviction. [Neutral]
DIVERGENCES & TRENDS
- Moving averages: Price ($245.00) is pinned between EMA 21 ($245.51) and SMA 200 ($245.97), so it is testing that resistance cluster from below. It stays above EMA 55 ($240.17), SMA 50 ($236.75) and VWAP ($232.34). Those averages are all rising and stacked as support.
- Long-term trend: SMA 50 is below SMA 200 ($236.75 vs $245.97), so there is no golden cross. The gap has narrowed from about $17 to $9 as SMA 50 rises, but it is not yet a confirmed long-term uptrend.
- Momentum: The Nov 6 MACD signal cross and the −DI/+DI cross came together with RSI falling from 71 to 51.5. This is a short-term bearish momentum shift.
- Price vs. indicators: Price made a lower high at $254.32 (Nov 4) versus $258.28 (Oct 29). MACD also made a lower high, so there is no real divergence. They confirm each other.
- CMF: It remains strongly positive and has not rolled over decisively. This tempers the bearish read and suggests dips may be bought near $237-240.
- ADX: A falling ADX with a bearish DI cross points to a corrective phase rather than a strong new downtrend.
CHART PATTERNS
- Bearish Double Top / Triple Top (loose): Highs cluster at $253-258 (Oct 23, Oct 29-30, Nov 4). The neckline is around $250 (Nov 3 low), and price has now closed below it. The measured move is about $8 (258 − 250), which gives a target near $242. A full measured-move extension reaches the EMA 55 / SMA 50 zone at $237-240.
- Context: The rally came from a rounded Sep-Oct base. A failure at the declining SMA 200 resistance would be a classic rejection. The pattern is not confirmed until price closes decisively below $240.
- Bullish alternative: If price holds $237-240 and reclaims $250, the pattern turns into a bullish consolidation (flag-like) after the Oct breakout. A move above $258 would target the $265 upper band and then $275.
POTENTIAL SCENARIOS
- Scenario 1: Bearish Pullback to Moving-Average Support — The double/triple-top neckline break, the MACD and DI bearish crosses and the SMA 200 rejection lead to a retracement toward EMA 55 and SMA 50. Trigger: daily close below $243 with −DI staying above +DI. Target: $236-240, with an extension to $230 if $236.75 breaks. Invalidation: daily close above $250 (the neckline reclaimed). (50% probability)
- Scenario 2: Bullish Reclaim and Continuation — Strong CMF accumulation and rising MAs support a bounce. Price reclaims SMA 200 and EMA 21 and retests the highs. Trigger: close above $250 with MACD re-crossing up. Target: $258, then $265 (upper band). Invalidation: close below $236.75. (30% probability)
- Scenario 3: Neutral Chop Around the 200-Day — Price oscillates between SMA 50 and the $255 area while ADX stays below 25. Trigger: ADX falls below 20 with no break of $237 or $255. Target: $238-$254 range. Invalidation: a close outside that range. (20% probability)
PRICE TARGETS
- Target Price: $239.00 (27-day horizon, Dec 5, 2026)
- Expected Range: $222.00 to $258.00. The width is $36, or about 14.7% of the current price, which fits the 27-day guidance of 12-18%.
- Key Levels: Support at $236.75 (SMA 50, with EMA 55 at $240.17 just above it), Resistance at $245.97 (SMA 200). Beyond that, resistance is at the $258.28 swing high.
OVERALL BIAS
OVERALL BIAS: BEARISH - Price slipped below EMA 21 and the SMA 200, MACD crossed below its signal, −DI crossed above +DI, and RSI has fallen from 71 to the midline after a lower high near $254-258. The likely path is a pullback toward the $237-240 support cluster. Conviction is modest because CMF accumulation and rising MAs should limit the downside.
This is educational analysis and not financial advice.