NFLX 27-day bearish forecast — Nov 8, 2026
- Bias: Bearish
- Timeframe: 27 days (made Nov 8, 2026, target date Dec 4, 2026)
- Price at analysis: $63.41
- Price target: $61.00
- Expected range: $54.50 – $67.00
- Result: Pending — graded after the close on Dec 4, 2026
Get a free AI analysis of NFLX today
Analysis
TECHNICAL INDICATORS
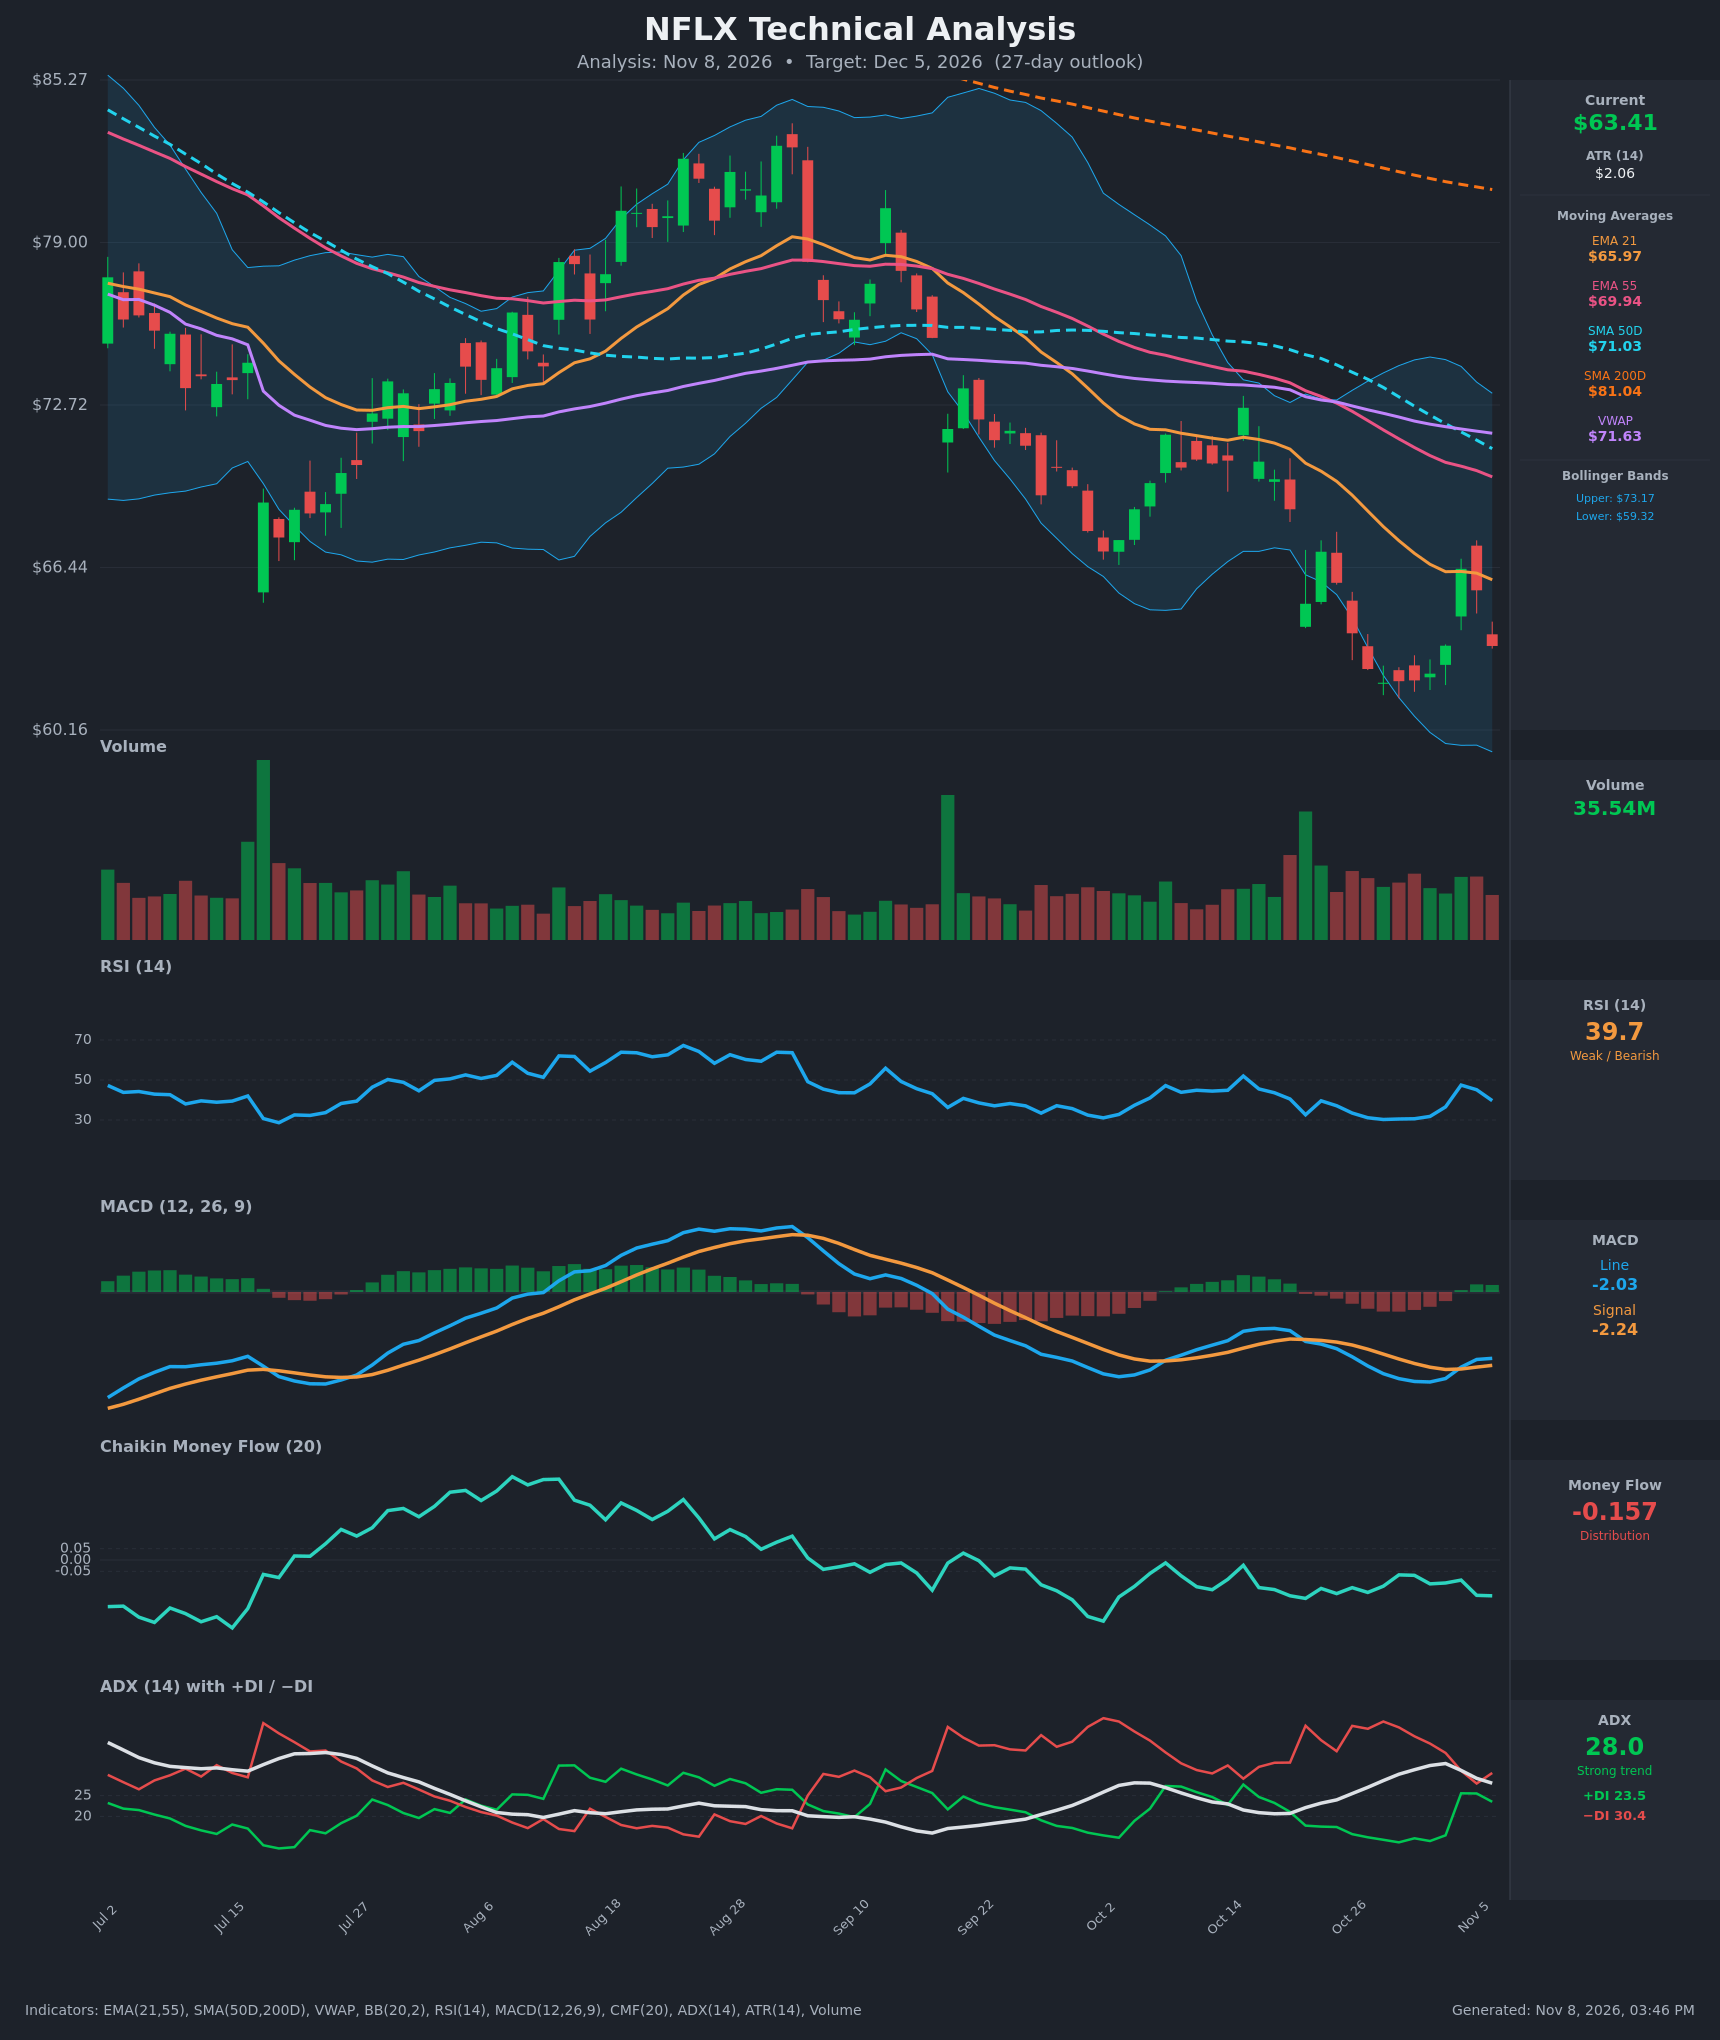
- RSI (14): 39.68. It bounced from oversold (~30) in late October to 47.5 on Nov 4, then rolled over again. It is below 50 and falling, with no oversold signal right now. [Bearish]
- 20 EMA (EMA 21): $65.97, with price at $63.41 below it. EMA 21 is also below EMA 55 ($69.94), so the EMA structure is bearish and the short-term average acts as resistance. The Nov 4 spike to $66.39 was rejected right at EMA 21. [Bearish]
- MACD: Line -2.03 vs Signal -2.24, so the line is slightly above the signal. The histogram is marginally positive and rising, which is a mild bullish crossover. Both lines are deep below zero, so this reads as a bounce within a downtrend, not a trend change. [Neutral]
- Bollinger Bands (20): Upper $73.17, lower $59.32, midline about $66.25. Price is in the lower half of the bands, about $4 above the lower band, after hugging the lower band in late October. The bands are wide, which reflects the volatility of the selloff. Price is below the midline, which is resistance near $66. [Bearish]
- CMF (20): -0.157, well below -0.05 and negative for the whole recent stretch. This is persistent distribution with no sign of accumulation. [Distribution]
- ADX (14): 28.0, above 25 but falling from a 32.7 peak. −DI (30.4) is above +DI (23.5). The trend is still strong and bearish, though the downtrend is losing some strength as +DI recovers. [Strong Trend – Bearish]
- Volume: 35.54M. Recent volume is around average with no capitulation spike. The last red candle came on moderate volume. The high-volume bar in late October was a down-move flush that has not led to a sustained reversal. [Neutral-to-Bearish: no accumulation confirmation]
DIVERGENCES & TRENDS
- Moving averages: Price is below every moving average: EMA 21 ($65.97), EMA 55 ($69.94), SMA50D ($71.03), SMA200D ($81.04) and VWAP ($71.63). The SMA50D is already below the SMA200D, which is a death cross that has been in place for months. The EMA 21/55 bearish cross is also well established.
- Price vs RSI: Price made a lower low around $61.99 in late October, while RSI bottomed near 30 in both late October and early July. There is no clear bullish divergence. The latest bounce failed under RSI 50 and EMA 21.
- MACD: The slight bullish crossover with a flattening histogram suggests the selling momentum is fading, but the lines remain far below zero.
- CMF: Distribution has persisted since September, and CMF is not confirming any bounce.
- ADX/DI: The −DI > +DI gap is narrowing, so bears have less control than two weeks ago. ADX is still above 25.
- Price structure: Lower highs since the late-August peak near $83. A consolidation base of roughly $62–$66.5 has formed in the last two weeks, with the Nov 4 pop failing at the top.
CHART PATTERNS
- Primary: The long-term structure is a rounded top followed by a sustained downtrend, with price making lower highs and lower lows from the ~$83 peak. This is consistent with a Bearish Head and Shoulders / reversal outcome, with the Aug–Sep high as the head.
- Near term: The last 8–10 bars form a small range of $62–$66.4, which looks like a Bearish Flag/Pennant after the sharp drop from $67 to $62. A break below ~$61.99 would project a measured move toward ~$57–$58. A bullish alternative is a Bullish Double Bottom near $62 (late October low and the retest), which would need a close above $66.4 and then EMA 21 resistance to confirm. That confirmation is missing.
- Targets: The bearish measured move is about $57–$58. A bullish double-bottom target would be about $70, near the EMA 55/SMA50D confluence.
POTENTIAL SCENARIOS
- Scenario 1: Bearish Breakdown of the Base — Price fails at EMA 21 (~$66) and breaks below the $62 double-bottom support. CMF distribution, −DI dominance and the stacked moving averages push the stock lower. Trigger: daily close below $61.90. Target: $57.50–$58.50. Invalidation: daily close above $66.50. (50% probability)
- Scenario 2: Neutral Range-Bound Chop — Price oscillates between $61.99 support and $66.4 resistance as momentum stabilizes with the MACD crossover. Trigger: failure to break either extreme. Target: $62–$66. Invalidation: close outside the $61.5–$67 band. (20% probability)
- Scenario 3: Bullish Relief Rally — The oversold bounce extends as the MACD crossover and the double-bottom attempt gain traction, and price reclaims EMA 21. Trigger: close above $66.50 on rising volume. Target: $69–$70 (EMA 55 / SMA50D area). Invalidation: close back below $62. (30% probability)
PRICE TARGETS
- Target Price: $61.00 (27-day)
- Expected Range: $54.50 to $67.00 (width $12.50, about 19.7% of the current price, in line with the 30–60 day band scaled for 27 days)
- Key Levels: Support at $61.99, Resistance at $65.97
OVERALL BIAS
OVERALL BIAS: BEARISH - Price is below all key moving averages, with a death cross in place, −DI above +DI with ADX above 25, persistent CMF distribution (-0.157), and a bounce that failed at EMA 21. The MACD uptick and the $62 base keep the odds from being overwhelming, but the evidence favors a downside break.
This is educational analysis and not financial advice.