NOK 27-day bearish forecast — Nov 8, 2026
- Bias: Bearish
- Timeframe: 27 days (made Nov 8, 2026, target date Dec 4, 2026)
- Price at analysis: $7.66
- Price target: $7.25
- Expected range: $6.40 – $8.40
- Result: Pending — graded after the close on Dec 4, 2026
Get a free AI analysis of NOK today
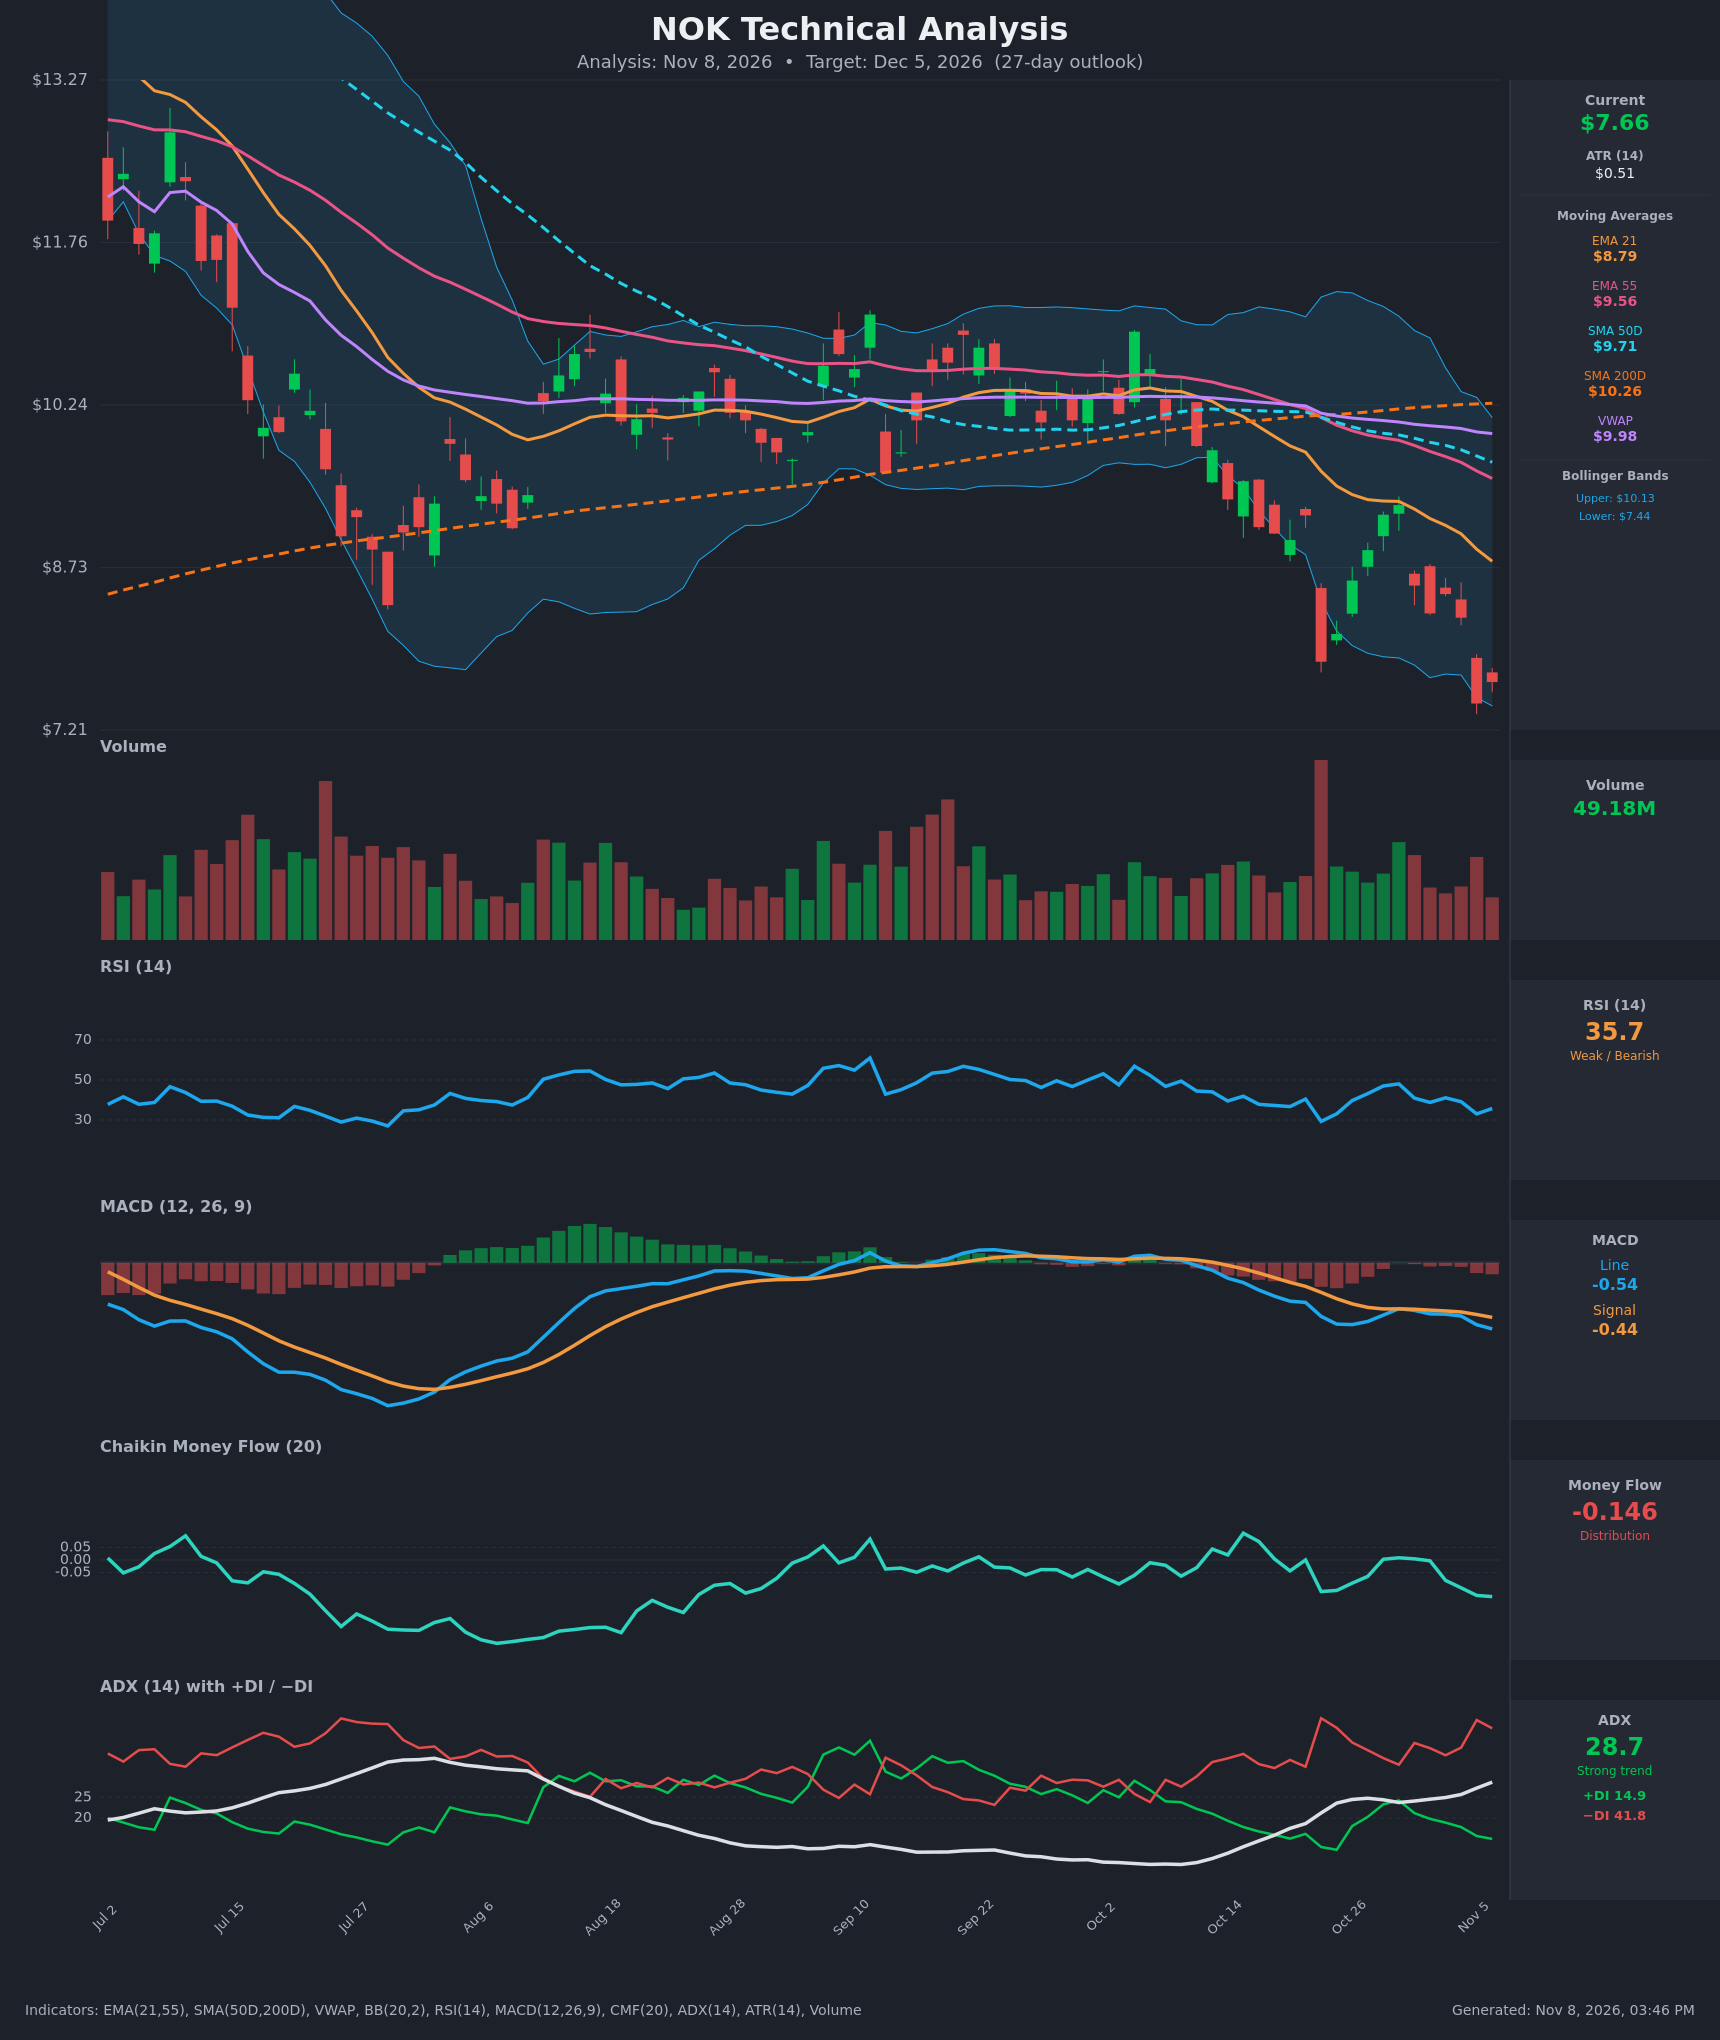
Analysis
TECHNICAL INDICATORS
- RSI (14): 35.75, below 50 and close to oversold. It bounced from 33.1 to 35.7 on the last bar but is still in a bearish range. It has made no bullish momentum shift, and the Oct 22 low of 29.3 was only briefly oversold. [Bearish]
- 20 EMA (21 EMA): $8.79, with price at $7.66 about 13% below it. The EMA is falling steeply (9.95 → 8.79 in 15 bars) and acts as overhead resistance. EMA21 is also below EMA55 ($9.56), a bearish alignment. [Bearish]
- MACD: Line -0.535 is below Signal -0.442, and the histogram is negative at about -0.09 and widening. The bearish crossover happened around Oct 29-30 and momentum is still deteriorating. [Bearish]
- Bollinger Bands (20): Price at $7.66 is near the lower band ($7.44), well below the midline (~$8.78). The bands are expanding downward, which suggests a trend-driven selloff rather than a squeeze. The Nov 5 close at $7.46 nearly tagged the lower band. A band-walk is possible, but a mean-reversion bounce is also likely. [Bearish]
- CMF (20): -0.146, well below -0.05 and falling from roughly 0 in late October. This is persistent distribution and selling pressure. [Distribution]
- ADX (14): 28.7 and rising, so the trend is strong. −DI at 41.8 is far above +DI at 14.9, so bears are firmly in control. [Strong Trend – Bearish]
- Volume: 49.18M, around average, with heavy red volume on the Oct 22 gap-down (the largest bar on the chart) and elevated selling on Nov 5. There is no capitulation spike yet on the latest leg, and the bounces have come on lighter volume. [Bearish – distribution]
DIVERGENCES & TRENDS
- No bullish divergence yet. Price made a new low at $7.46 on Nov 5 and RSI also made a lower low (33.1, versus 29.3 on Oct 22 which was lower still). RSI is not confirming a reversal, and MACD is making new lows with price.
- Moving average structure: Price is below EMA21, EMA55, SMA50D ($9.71), SMA200D ($10.26) and VWAP ($9.98). The SMA50D is now below the SMA200D (about $9.71 vs $10.26), which is a death cross in place, and the average gap is widening.
- Bearish MACD crossover since late October, with the histogram widening. The momentum trend is down.
- DI/ADX: −DI has been above +DI since Oct 19, and +DI briefly rose to 24 on Oct 29 before rolling over. ADX has climbed from 15.8 to 28.7, confirming trend strength.
- Price action: Lower highs and lower lows since the Oct 2 high near $10.5. Bounces are failing near the falling EMA21 (around $9.2-9.3 on Oct 28-29).
CHART PATTERNS
- Bearish Rising/Expanding structure with descending-triangle-like breakdown: After a long range between roughly $8.7 and $10.8 from August to October, price broke below the base around $8.7-9.0 on Oct 22, which resembles a range breakdown (a Descending Triangle or Triple Top breakdown from the reference). The measured move is the range height (~$2.0) projected from the breakdown level (~$8.7), pointing to about $6.7-7.0.
- Lower Bollinger Band support near $7.44 and the Nov 5 low at $7.46 form a minor double-bottom-like floor, but it is not confirmed (no neckline break above ~$8.3-8.5).
- The most recent bounces look like a Bearish Flag/Pennant after the sharp drop, a continuation pattern. The first major resistance on any bounce is the $8.3-8.5 zone.
POTENTIAL SCENARIOS
- Scenario 1: Bearish Trend Continuation — The downtrend continues with −DI dominant, CMF negative and a widening MACD gap. Price breaks the Nov 5 low and the lower band, then grinds lower. Trigger: Daily close below $7.46. Target: $6.70-7.10. Invalidation: Daily close above $8.30 (the prior swing high and flag top). (50% probability)
- Scenario 2: Neutral/Bullish Oversold Bounce Then Fade — A mean-reversion bounce toward the falling EMA21 and the mid-band, which then stalls and rolls over. Trigger: RSI holds above 30 and price reclaims $8.10-8.30. Target: $8.30-8.80. Invalidation: Failure at $8.80 (EMA21) leads back to the lows, or a drop below $7.40. (35% probability)
- Scenario 3: Bullish Reversal — Capitulation volume forms a base with a bullish RSI divergence, and price reclaims the EMA21 and VWAP. Trigger: Close above $8.80 with rising volume. Target: $9.50-9.70 (EMA55/SMA50D). Invalidation: Close below $7.40. (15% probability)
PRICE TARGETS
- Target Price: $7.25 (27 days, bearish drift with a likely bounce along the way)
- Expected Range: $6.40 to $8.40 (width $2.00 ≈ 26% of current price; the 27-day horizon sits in the 12-18% to 18-30% band, and this width reflects the elevated ATR of $0.51 plus an extra downside tail)
- Key Levels: Support at $7.40 (lower Bollinger Band/Nov 5 low region), Resistance at $8.30 (recent flag top, with EMA21 at $8.79 above)
OVERALL BIAS
OVERALL BIAS: BEARISH - Price is below every moving average with a death cross in place, MACD is bearish and widening, CMF shows distribution, and ADX is at 28.7 with −DI (41.8) far above +DI (14.9). Oversold bounces are possible near the lower band, but the weight of evidence favors lower prices over 27 days.
This is educational analysis and not financial advice.