ORCL 27-day bearish forecast — Nov 8, 2026
- Bias: Bearish
- Timeframe: 27 days (made Nov 8, 2026, target date Dec 4, 2026)
- Price at analysis: $116.10
- Price target: $111.00
- Expected range: $98.00 – $122.00
- Result: Pending — graded after the close on Dec 4, 2026
Get a free AI analysis of ORCL today
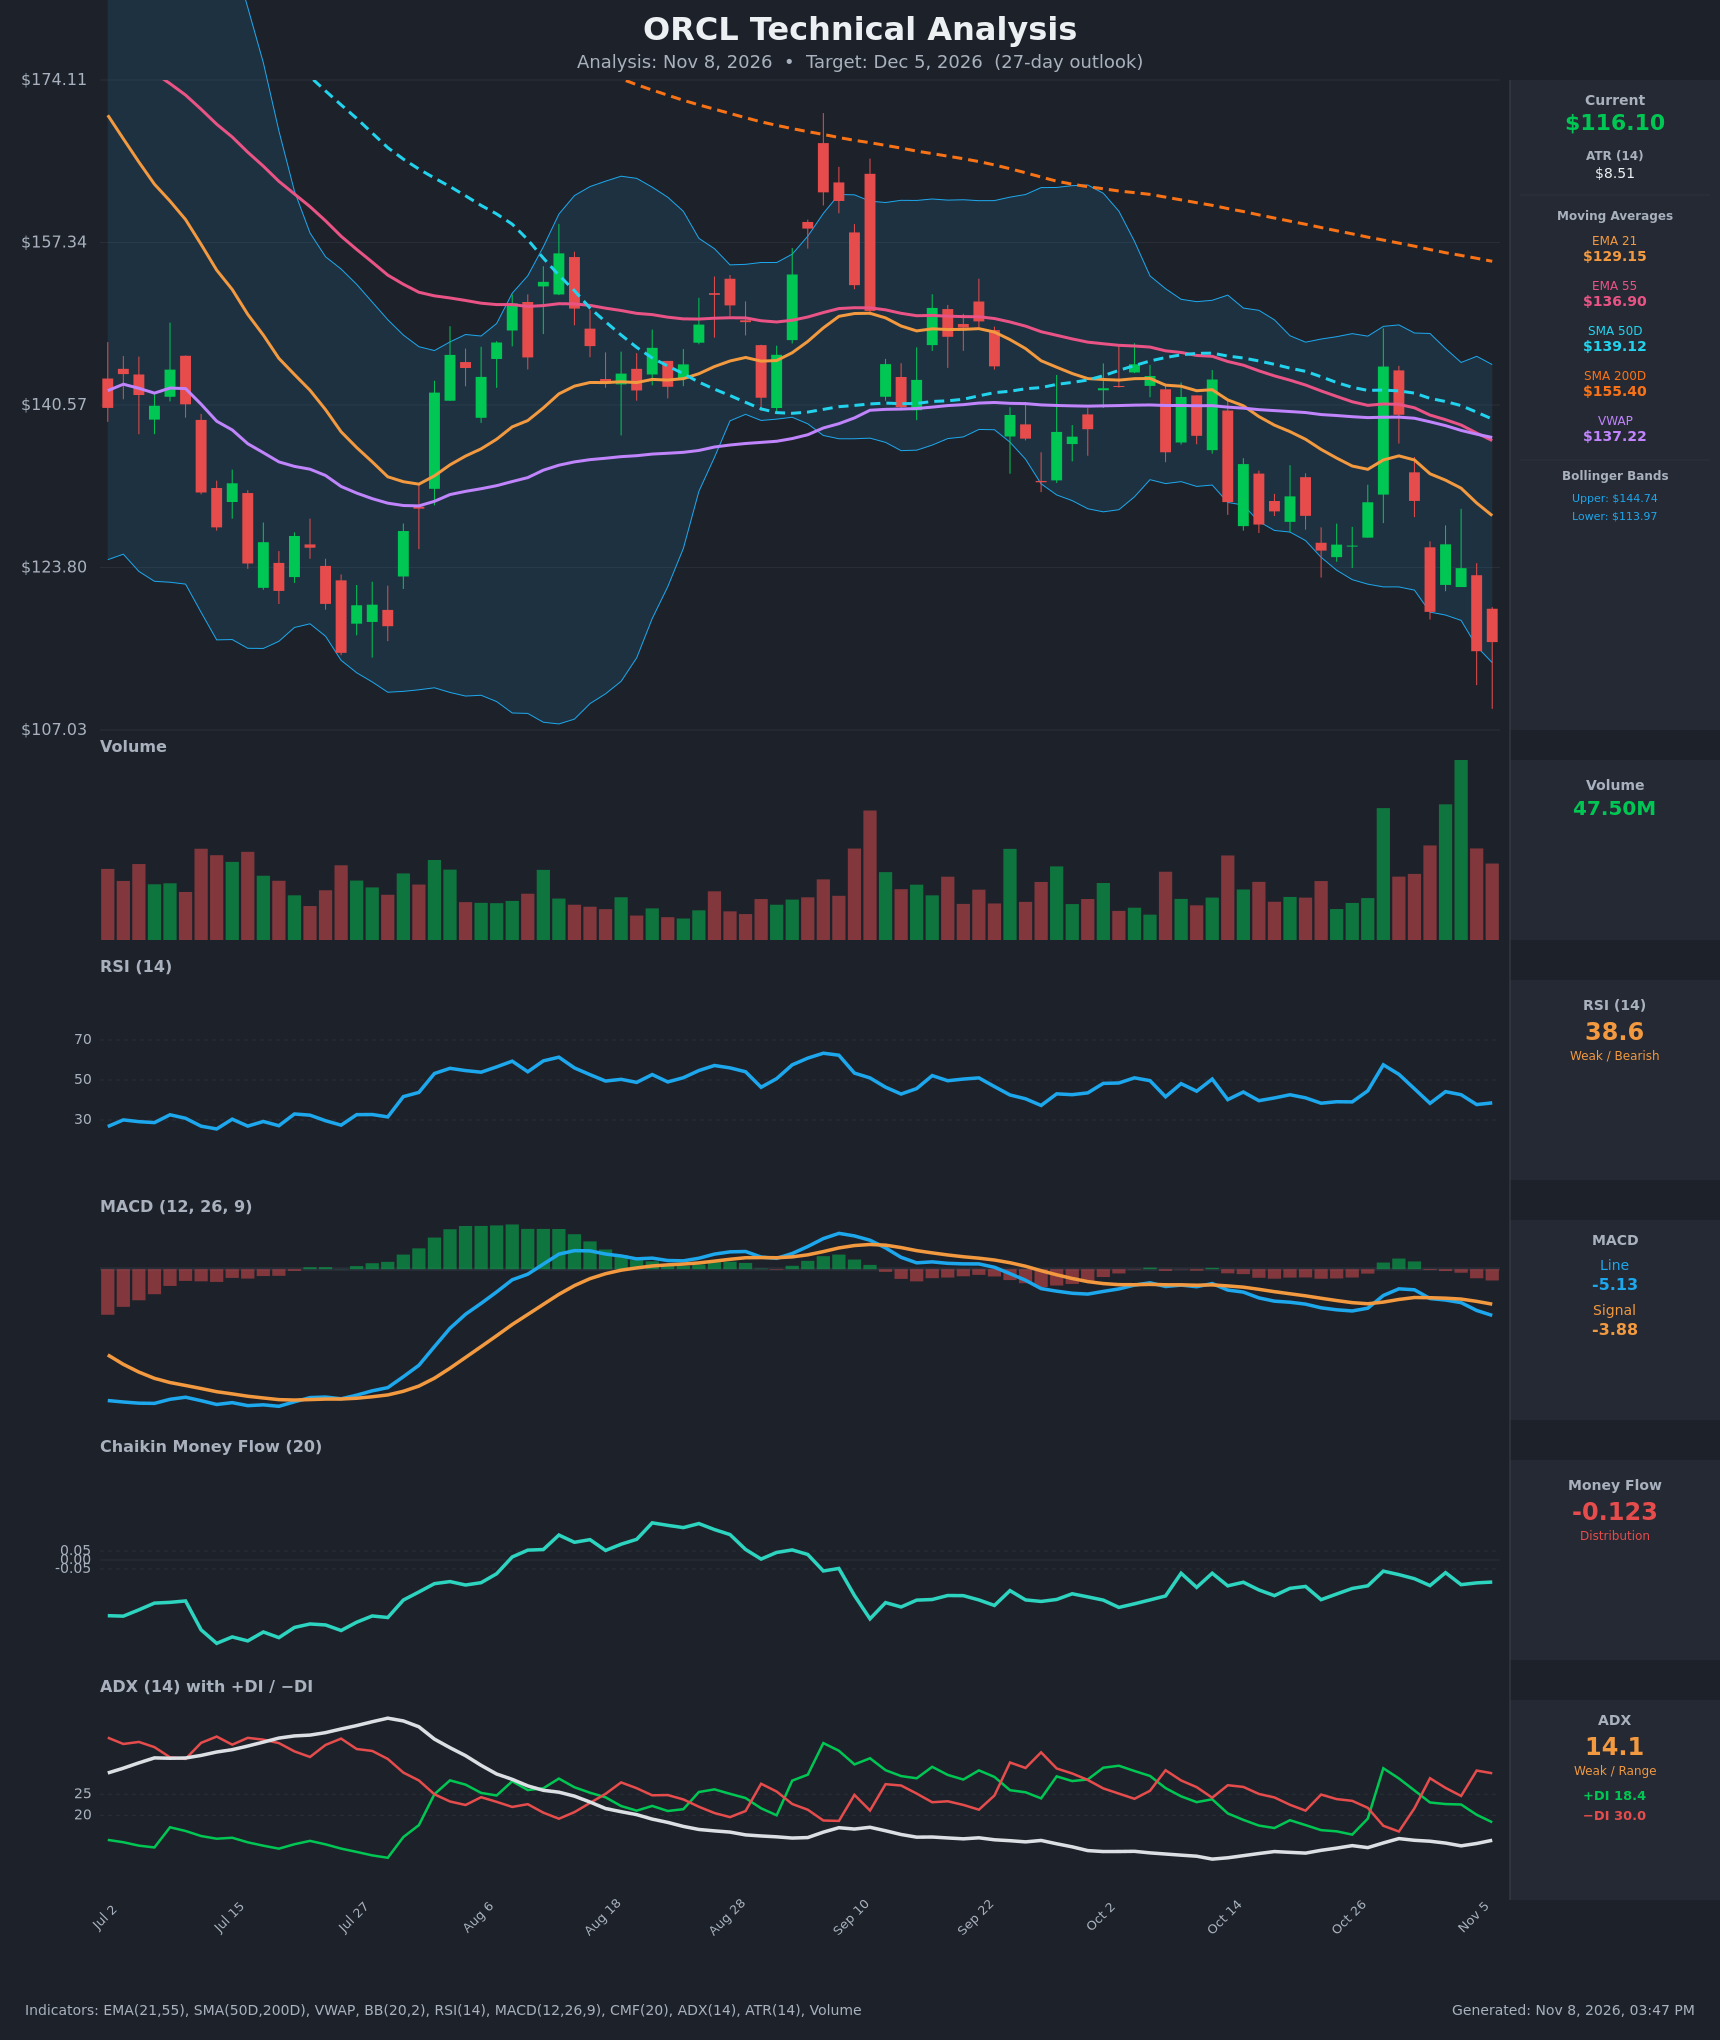
Analysis
TECHNICAL INDICATORS
- RSI (14): 38.56, below 50 and approaching oversold but not there yet. It has made lower highs since the Oct 28 spike to 57.6, and the latest readings (38.3, 37.7, 38.6) show momentum stuck in the bearish zone. [Bearish]
- 20 EMA: The EMA 21 is $129.15 and price at $116.10 is about 10% below it. The EMA is sloping down steadily and acting as overhead resistance. EMA 21 is below EMA 55 ($136.90), a bearish alignment. [Bearish]
- MACD: The MACD line is -5.129, below the signal at -3.880, and the histogram is about -1.25 and widening. The line re-crossed below the signal around Nov 2–5, so bearish momentum is accelerating. [Bearish]
- Bollinger Bands (20): Upper band $144.74, lower band $113.97. Price at $116.10 sits in the lower band, only about $2 above the lower band. The recent candles are walking the lower band, and the wide bands reflect the high volatility from the Oct 28 spike. This setup can signal a downtrend continuing or a short-term mean-reversion bounce. [Bearish]
- CMF (20): -0.123, well below -0.05, and negative on every recent bar (-0.062 to -0.222). Sustained selling pressure. [Distribution]
- ADX (14): 14.1 with −DI (30.0) above +DI (18.4). The trend is weak by ADX standards (<20), but directional control clearly belongs to the bears, and the −DI/+DI spread is widening again. [Weak Trend, bearish direction]
- Volume: 47.50M, elevated relative to the recent average, with heavy volume on the red candles of the last several sessions. That points to active distribution and a lack of dip-buying so far. [Bearish – selling on rising volume]
DIVERGENCES & TRENDS
- Price is making new lows (the $115.16 close on Nov 5), while RSI is at 37.7–38.6, only marginally lower than its prior trough of 38.3. This is a mild stabilization in RSI but no confirmed bullish divergence.
- MACD is making new lows with the histogram expanding, with no divergence. Momentum confirms price weakness.
- Long-term trend structure is bearish. The death cross is already in place (SMA50D $139.12 is below SMA200D $155.40, and the gap is widening). Price is about 25% below the SMA200D and about 17% below the SMA50D.
- The EMA 21 < EMA 55 < SMA50D < SMA200D stack is fully bearish. VWAP at $137.22 is well above price, meaning buyers over the period are underwater.
- The Oct 28 spike to $144.54 was completely retraced within about 6 sessions, and it was a failed breakout and a bull trap. CMF stayed negative through the move.
- ADX at 14 means the trend is not yet strong, so sharp counter-trend bounces are likely. Direction still favors the bears.
CHART PATTERNS
- Bearish channel / descending staircase: Since September's top near $170 the sequence of lower highs and lower lows is intact. The chart most closely resembles a Bearish Flag/Pennant continuation after the earlier sharp drop, with a measured move lower.
- The Oct 28 spike failure produced a lower high around $144, a lower-high rejection. Also note the break below the Oct 14–26 consolidation range, a descending-triangle-style breakdown with support near $125 now flipped to resistance.
- The pattern is not a textbook match, but the downside continuation interpretation fits. The measured move from the consolidation range (~$125–$140) points to roughly $110 or lower. A bullish reversal would need a close back above the $125–$130 zone, which is not yet visible.
- A hammer-like long lower wick on the latest candle (low near $107–$110) shows some dip-buying interest, but there is no confirmation.
POTENTIAL SCENARIOS
- Scenario 1: Bearish Continuation Lower — The downtrend persists under the control of −DI and negative CMF, with price riding the lower Bollinger Band and the MACD histogram expanding. Trigger: a daily close below $113.97 (the lower band) and the ~$110 wick low. Target: $104–$108, with an extension to ~$100 on a capitulation flush. Invalidation: a daily close above $125 (EMA 21 and prior breakdown zone). (50% probability)
- Scenario 2: Neutral Base and Chop — Price stabilizes between ~$108 and ~$126 as RSI near 30–40 limits downside while the falling EMAs cap rallies. ADX at 14 supports sideways drift. Trigger: holding above $110 for several sessions with fading volume. Target: $112–$122 range. Invalidation: a close below $108 or above $128. (25% probability)
- Scenario 3: Bullish Oversold Bounce — A mean-reversion rally from the lower band and the long lower wick, targeting the EMA 21. Trigger: a close above $122 on rising volume and the MACD histogram turning up. Target: $128–$130 (EMA 21), possibly $137 (VWAP/EMA 55). Invalidation: a failure at $125 or a close below $110. (25% probability)
PRICE TARGETS
- Target Price: $111.00 (27 days)
- Expected Range: $98.00 to $122.00 (width $24 = ~20.7% of the current price, consistent with the 18–30% guidance for roughly 27 days, though at the upper end because of elevated ATR of $8.51)
- Key Levels: Support at $110.00, Resistance at $125.00
OVERALL BIAS
OVERALL BIAS: BEARISH - Price is in a confirmed downtrend with a full bearish MA stack (death cross, price below all EMAs/SMAs/VWAP), MACD below signal with an expanding negative histogram, −DI dominant, and persistently negative CMF on heavy volume. Oversold-bounce risk is real given the lower-band proximity, but the evidence favors further downside.
This is educational analysis and not financial advice.