NBIS 27-day bearish forecast — Nov 8, 2026
- Bias: Bearish
- Timeframe: 27 days (made Nov 8, 2026, target date Dec 4, 2026)
- Price at analysis: $129.49
- Price target: $121.50
- Expected range: $110.00 – $133.00
- Result: Pending — graded after the close on Dec 4, 2026
Get a free AI analysis of NBIS today
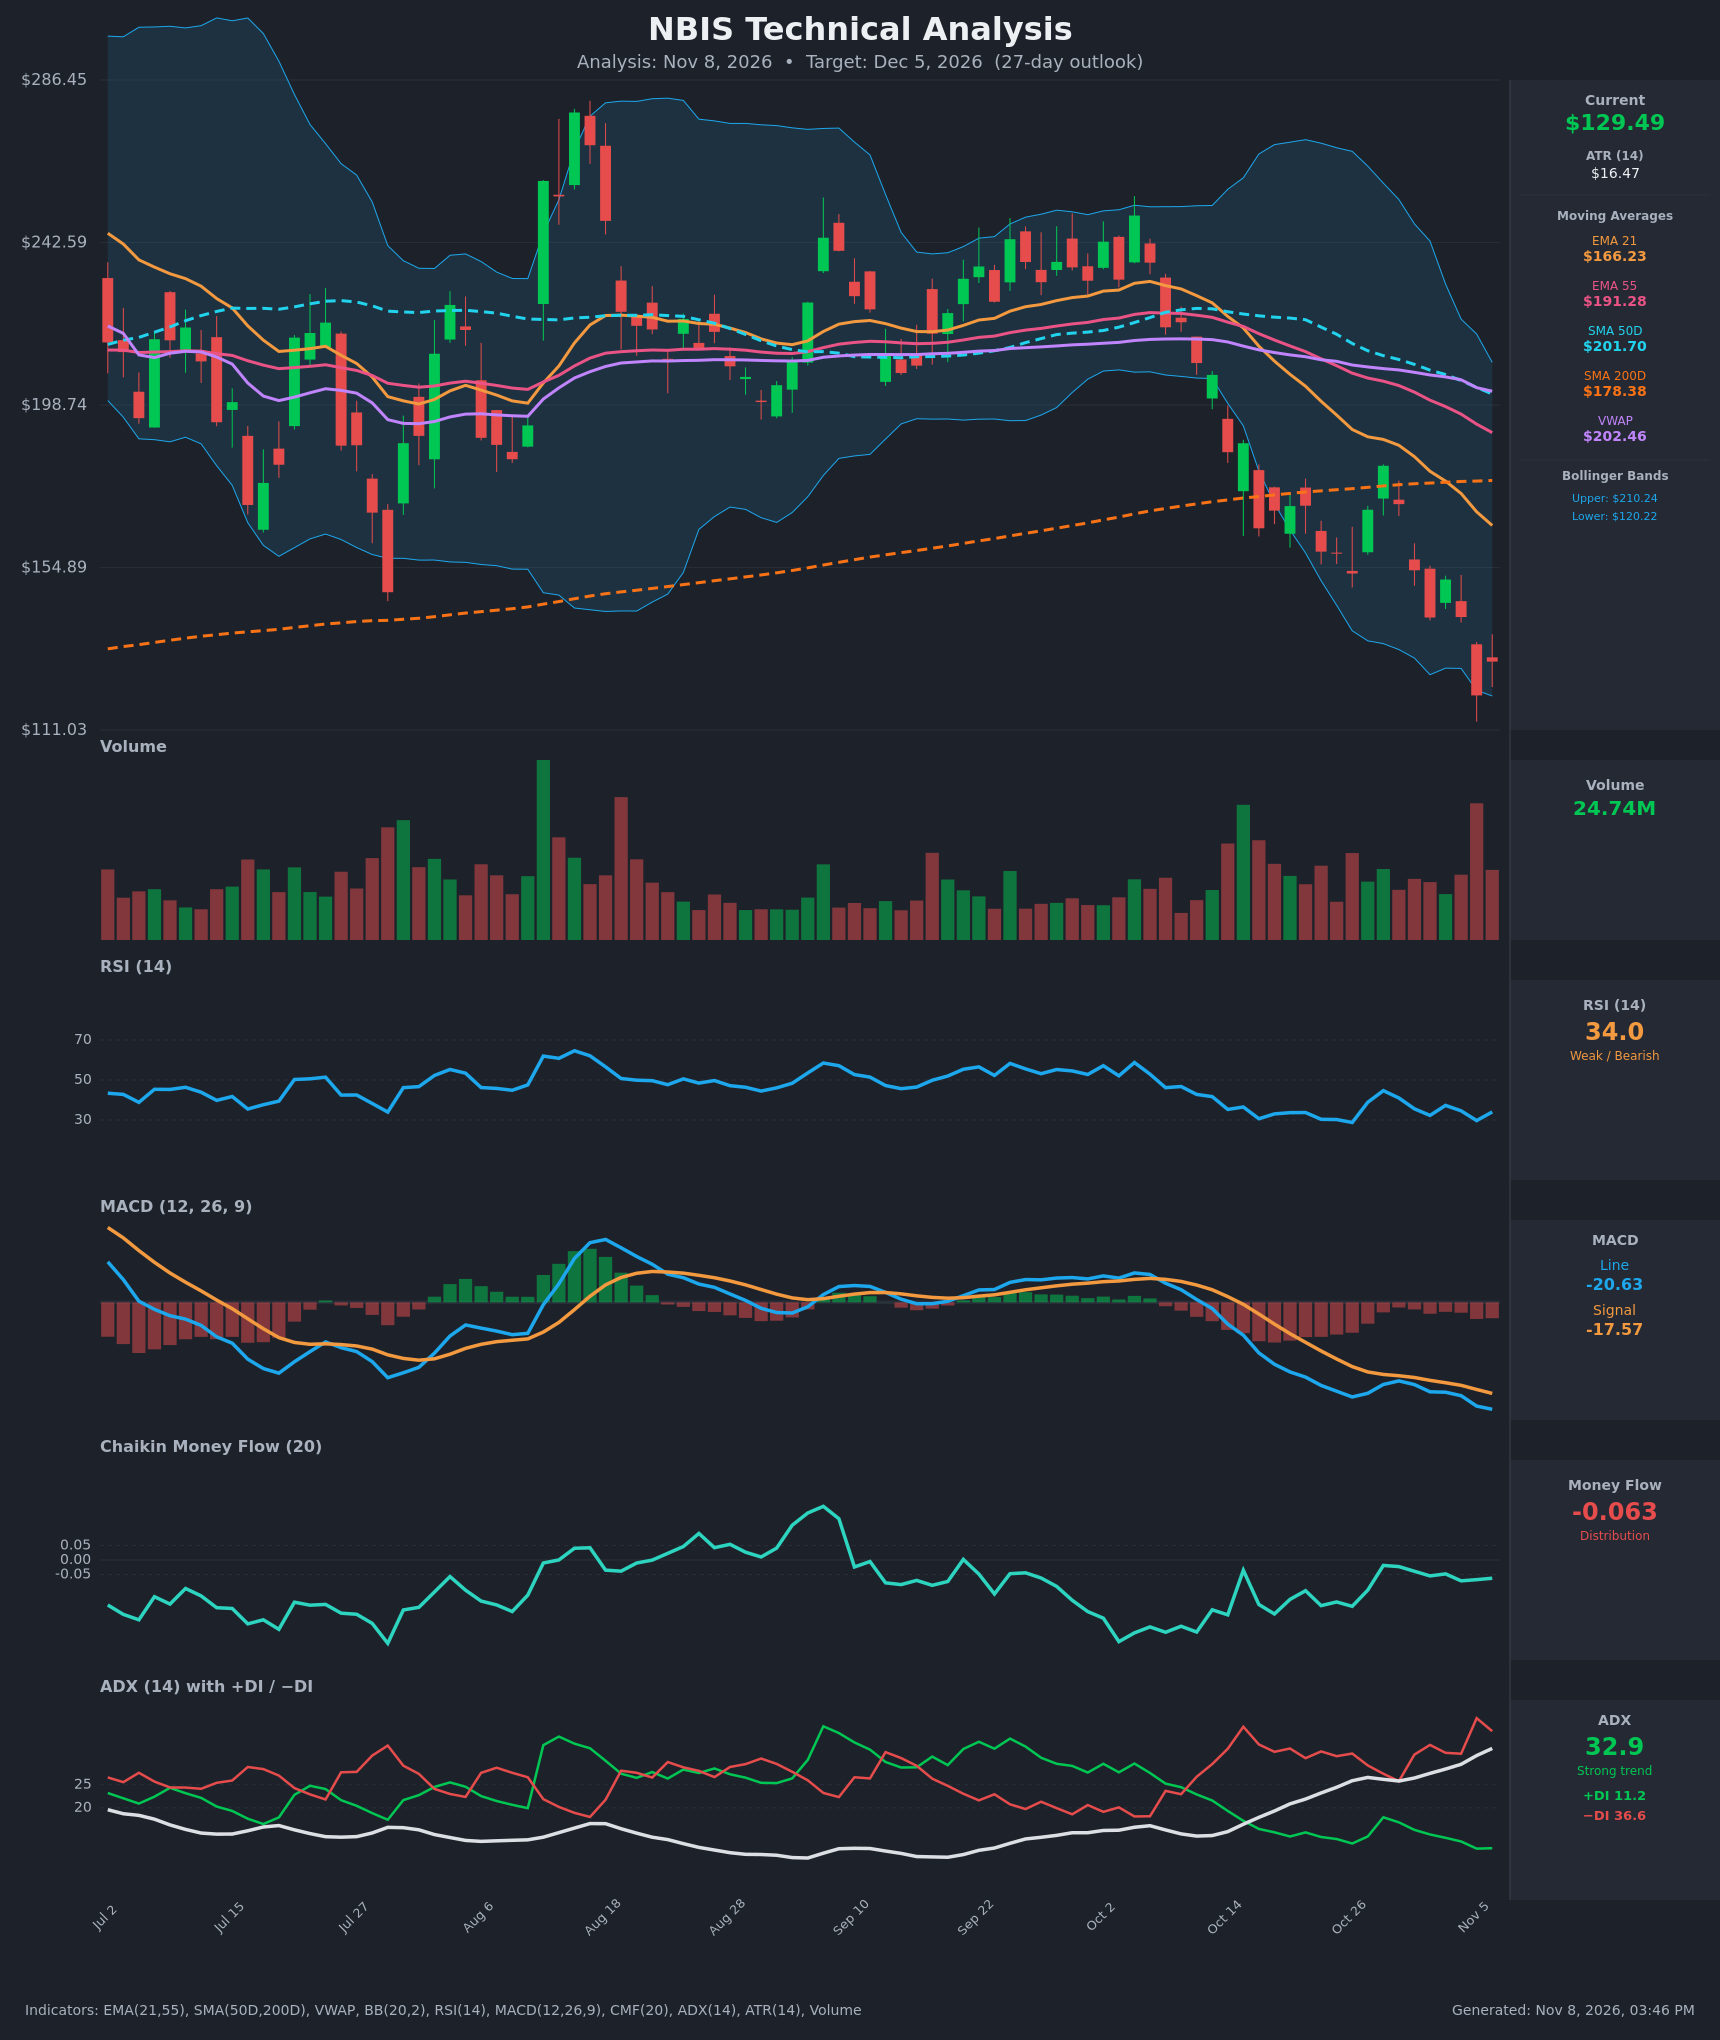
Analysis
TECHNICAL INDICATORS
- RSI (14): 34.03, rebounding off 29.7 on Nov 5 but still below 40 and far from 50. It has been capped under 45 since the Oct 28 bounce failed. Momentum is weak with only a tentative oversold bounce. [Bearish]
- 20 EMA: The chart plots EMA 21 at $166.23, about 28% above price and falling steeply (from $210.58 on Oct 19). EMA 21 is also below EMA 55 ($191.28). Price has stayed below it for weeks, so it is overhead resistance. [Bearish]
- MACD: Line -20.63 is below signal -17.57, a histogram of about -3.06. The gap has been widening since Oct 30, and both lines are deeply negative and still falling, with no bullish crossover in sight. [Bearish]
- Bollinger Bands (20): Upper $210.24, lower $120.22. Price at $129.49 sits in the lower part of the band after Nov 5 closed at $120.37, right on the lower band. The bands are wide, so volatility is high. This is a band walk in a downtrend, with some mean-reversion risk because price is stretched. [Bearish]
- CMF (20): -0.063, below the -0.05 threshold and negative on every bar in the table. It improved from -0.186 on Oct 19 but is now sliding again. That is persistent, mild distribution. [Distribution]
- ADX (14): 32.9 and rising (from 19.3 on Oct 19), with -DI 36.6 far above +DI 11.2. The trend is strong, and the bears are firmly in control. [Strong Trend – Bearish]
- Volume: 24.74M on the latest bar. The spike on the Nov 5 breakdown to $120 shows capitulation-style selling, and sell-offs have carried heavier volume than bounces. There is no clear volume confirmation of a reversal yet. [Bearish / possible exhaustion]
DIVERGENCES & TRENDS
- Mild RSI divergence: The Nov 5 price low ($120.37) is far below the Oct 26 low ($153.27), yet RSI printed 29.7 versus 28.8. That is a slight bullish non-confirmation, which supports a relief bounce. It is not a reversal signal on its own.
- MACD: No divergence. It makes lower lows with price (-20.6 versus -18.2 on Oct 26), which confirms the downtrend.
- Moving averages: Price is below EMA 21, EMA 55, SMA 50D ($201.70), VWAP ($202.46), and now SMA 200D ($178.38). Price is about 27% below the SMA 200D, which previously acted as support and has turned into resistance. EMA 21 is below EMA 55, a bearish crossover that is already in place. SMA 50D is still above SMA 200D, but the gap has narrowed from about $48 in mid-October to about $23. A death cross is plausible within weeks if price stays depressed.
- DI and ADX: -DI is above +DI, and ADX has risen from below 20 to nearly 33. This is a trend that is gaining strength, not exhausting.
- Price structure: The sequence of lower highs ($275 in Aug, then about $250, then $182 on Oct 28) and lower lows is intact. Oct 28's bounce to $182 was fully retraced within a week.
CHART PATTERNS
- Bearish Head and Shoulders (reversal): There is a left shoulder in July (about $240), a head in mid-Aug (about $275), and a right shoulder in late Sep/early Oct (about $250). The neckline is around $200–$205 and broke decisively in mid-October. The measured move is head $275 minus neckline $200, about $75 projected from the neckline, which gives roughly $125–$130. Price is already near that target, so much of the pattern's move may be completed.
- Bearish flag/pennant (continuation): The Oct 27–29 bounce to $182 and the failure afterward resemble a small bearish flag, which was resolved by the break to $120. After such a break, price often retests the breakdown zone from below.
- Takeaway: The bearish patterns have largely played out to their targets, so downside from here is likely limited and choppy. A relief rally into $140–$150 is plausible within a still-bearish structure.
POTENTIAL SCENARIOS
- Scenario 1: Bearish Trend Continuation / Lower Lows — Price fails to reclaim the $140 area. The -DI/ADX trend and MACD momentum keep pushing it back toward and below the lower Bollinger Band. Trigger: a daily close below $120. Target: $110–$118, with the Nov 5 wick low near $112 as a key test. Invalidation: a daily close above $142 with rising volume. (50% probability)
- Scenario 2: Bullish Oversold Relief Bounce — RSI is below 35 and price is stretched against the lower band, and RSI shows mild divergence. A short-covering rally could carry price toward the Nov 2–4 breakdown zone. Trigger: a close above about $141.50, the Nov 2/4 closes. Target: $145–$155. This is likely to stall below the $166 EMA 21. Invalidation: a close back below $120. (35% probability)
- Scenario 3: Neutral Basing Chop — Price stabilizes after the capitulation and ranges between roughly $120 and $140 as ADX peaks and volatility compresses. Trigger: several sessions of inside bars on declining volume. Target: $125–$135. Invalidation: a close outside the $120–$142 range. (15% probability)
PRICE TARGETS
- Target Price: $121.50 (27-day horizon, below the current $129.49)
- Expected Range: $110.00 to $133.00. The width is $23, or about 17.8% of the current price, in line with the 30–60 day guidance given the high ATR of $16.47.
- Key Levels: Support at $120.00, Resistance at $141.50
OVERALL BIAS
OVERALL BIAS: BEARISH - Price is below every major moving average. ADX is 32.9 and rising with -DI at 36.6 versus +DI at 11.2, MACD is below its signal with a widening gap, and CMF shows distribution. The head-and-shoulders measured target is largely reached, so expect an oversold bounce attempt, but the path of least resistance remains down.
This is educational analysis and not financial advice.