NVDA 27-day bearish forecast — Nov 8, 2026
- Bias: Bearish
- Timeframe: 27 days (made Nov 8, 2026, target date Dec 4, 2026)
- Price at analysis: $186.64
- Price target: $180.00
- Expected range: $166.00 – $196.00
- Result: Pending — graded after the close on Dec 4, 2026
Get a free AI analysis of NVDA today
Analysis
TECHNICAL INDICATORS
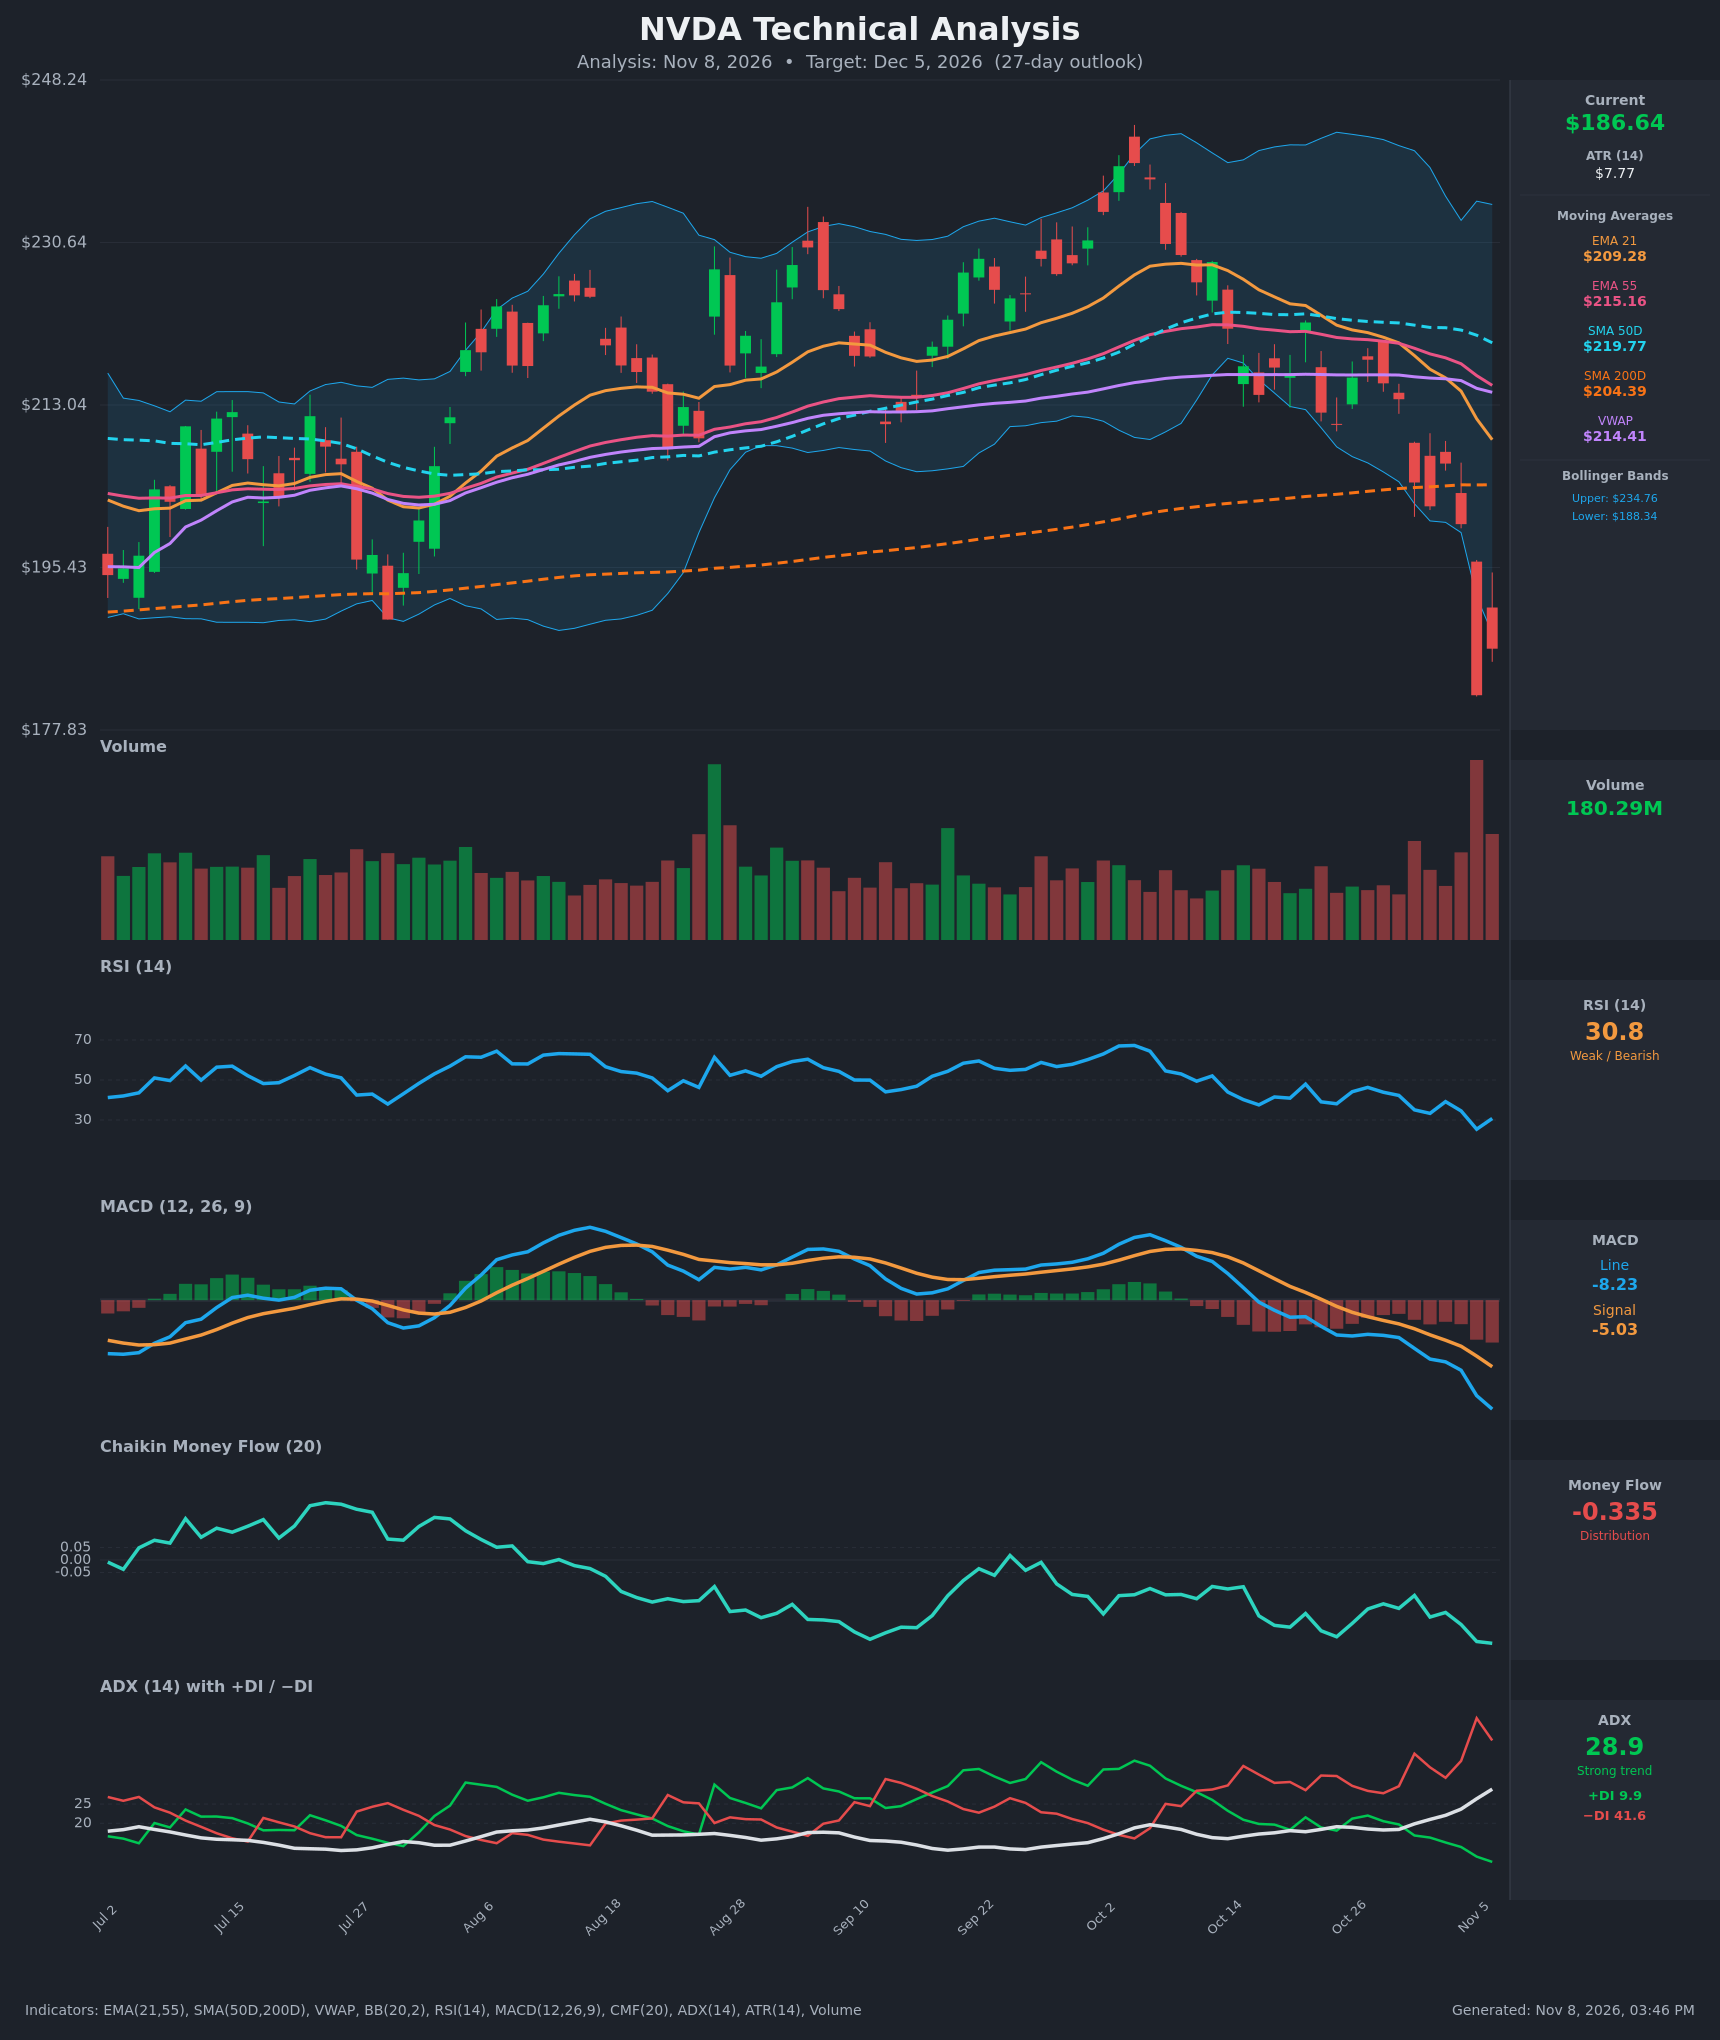
- RSI (14): 30.77, up slightly from 25.4 on Nov 5 but still at the edge of oversold. It fell from about 67 in early October to 30 in a steady downtrend. A bounce from oversold is possible, but there is no bullish divergence yet. [Bearish]
- 20 EMA (EMA 21): $209.28, about 12% above the $186.64 price. Price is far below it, so it acts as overhead resistance. EMA 21 is also below EMA 55 ($215.16), a bearish crossover that has already happened. [Bearish]
- MACD: Line -8.23 is below Signal -5.03, and the gap is widening (-4.23 to -5.03 on the signal, -7.21 to -8.23 on the line). The histogram is deeply negative and expanding, so downside momentum is still accelerating. [Bearish]
- Bollinger Bands (20): Upper $234.76, lower $188.34. Price is $186.64, just below the lower band after the Nov 5 breakdown candle pierced it sharply. This shows a strong downside expansion. Price is oversold in the short term, but "walking the band" in a strong trend often continues. [Bearish]
- CMF (20): -0.335, far below -0.05 and at the weakest level on the chart. This is persistent, heavy distribution that has worsened through the decline. [Distribution]
- ADX (14): 28.9 and rising (17.5 to 28.9 in two weeks), with −DI at 41.6 far above +DI at 9.9. The bears are in firm control and the downtrend is strengthening. [Strong Trend – Bearish]
- Volume: 180.29M on the latest bar, with the Nov 5 breakdown candle on the heaviest volume of the period. Heavy volume on a red candle confirms distribution. It could also mark a capitulation spike, so a relief bounce is possible. [Bearish with capitulation risk]
Other moving averages: price is below the SMA50D ($219.77), VWAP ($214.41) and the SMA200D ($204.39). Losing the 200-day is a major long-term break. The SMA50D remains above the SMA200D, so there is no death cross yet, but the gap is narrowing ($219.77 vs $204.39).
DIVERGENCES & TRENDS
- There is no bullish divergence. RSI made a new low at 25.4 on Nov 5 along with price, and MACD and CMF are also at new lows. Momentum confirms price rather than diverging from it.
- RSI and the Bollinger position are oversold. This raises the odds of a short-term relief bounce, but oversold readings alone are not reversal signals when ADX is rising and −DI dominates.
- MACD crossed below signal around Oct 22–23 and has widened since. EMA 21 crossed below EMA 55 around Oct 29–30, and price broke below the SMA200D on Nov 5. These are sequential bearish confirmations.
- The −DI spike (47.4 on Nov 5, now 41.6) and ADX at 28.9 mark a fresh, strong downtrend.
- CMF has trended lower since mid-August, ahead of the price decline. This long-running distribution warned of the weakness.
- Price is about 22% below the Oct 2 peak near $240 and has lost every key moving average.
CHART PATTERNS
- Bearish Double Top (loose): The peaks near $235 (late Aug) and $240 (Oct 2) form a rough double top. The neckline is near $200–205, around the SMA200D, and the Nov 5 breakdown pushed through it. The measured move (about $38 of pattern height) projects toward $165. This is an approximate match and not a textbook pattern.
- Bearish Flag (late October): The small sideways-to-rising consolidation from Oct 14 to Oct 29 near $210–$218 followed the early-October drop. It broke down sharply with a -9% candle. The flag's measured move supports further downside toward the mid-$170s.
- A Bullish Falling Wedge is not yet visible. The decline is too steep and has no converging trendlines or divergence.
- The key near-term question is whether $181.60 (the Nov 5 low) holds. A break below opens the way toward the $165–$175 zone.
POTENTIAL SCENARIOS
- Scenario 1: Bearish Trend Continuation — The breakdown below the SMA200D, MACD momentum, −DI dominance and heavy distribution drive further selling. Any bounce stalls under the lower-band and SMA200D area. Trigger: close below $181.60. Target: $172–$165 (double-top and flag measured-move zone). Invalidation: daily close above $204.39 (SMA200D reclaim). (50% probability)
- Scenario 2: Bullish Oversold Relief Bounce — RSI near 30, price below the lower Bollinger Band and the capitulation-style volume spike bring a mean-reversion bounce. It would stall below the falling EMA 21 and VWAP. Trigger: close above $194–$195 with RSI back above 40. Target: $200–$209 (SMA200D and EMA 21 as resistance). Invalidation: close below $181.60. (35% probability)
- Scenario 3: Neutral Basing Range — Price stabilizes between roughly $178 and $198 as selling exhausts and the bounce lacks conviction. Trigger: several sessions holding above $181.60 while failing at $195. Target: about $186–$190. Invalidation: close outside $178–$198. (15% probability)
PRICE TARGETS
For the 27-day horizon:
- Target Price: $180.00
- Expected Range: $166.00 to $196.00 (width $30, about 16% of the current price, within the 12–18% guidance for a 30–60 day window scaled to 27 days)
- Key Levels: Support at $181.60 (Nov 5 low), Resistance at $204.39 (SMA200D)
OVERALL BIAS
OVERALL BIAS: BEARISH - Price sits below all major moving averages including the SMA200D, with MACD widening negative, CMF at -0.335 (heavy distribution), and ADX 28.9 rising with −DI far above +DI. Oversold RSI raises the odds of a relief bounce, so conviction is moderate, but the evidence favors a retest or break of the $181.60 low.
This is educational analysis and not financial advice.