RKLB 27-day bearish forecast — Nov 8, 2026
- Bias: Bearish
- Timeframe: 27 days (made Nov 8, 2026, target date Dec 4, 2026)
- Price at analysis: $53.07
- Price target: $51.00
- Expected range: $45.00 – $59.00
- Result: Pending — graded after the close on Dec 4, 2026
Get a free AI analysis of RKLB today
Analysis
TECHNICAL INDICATORS
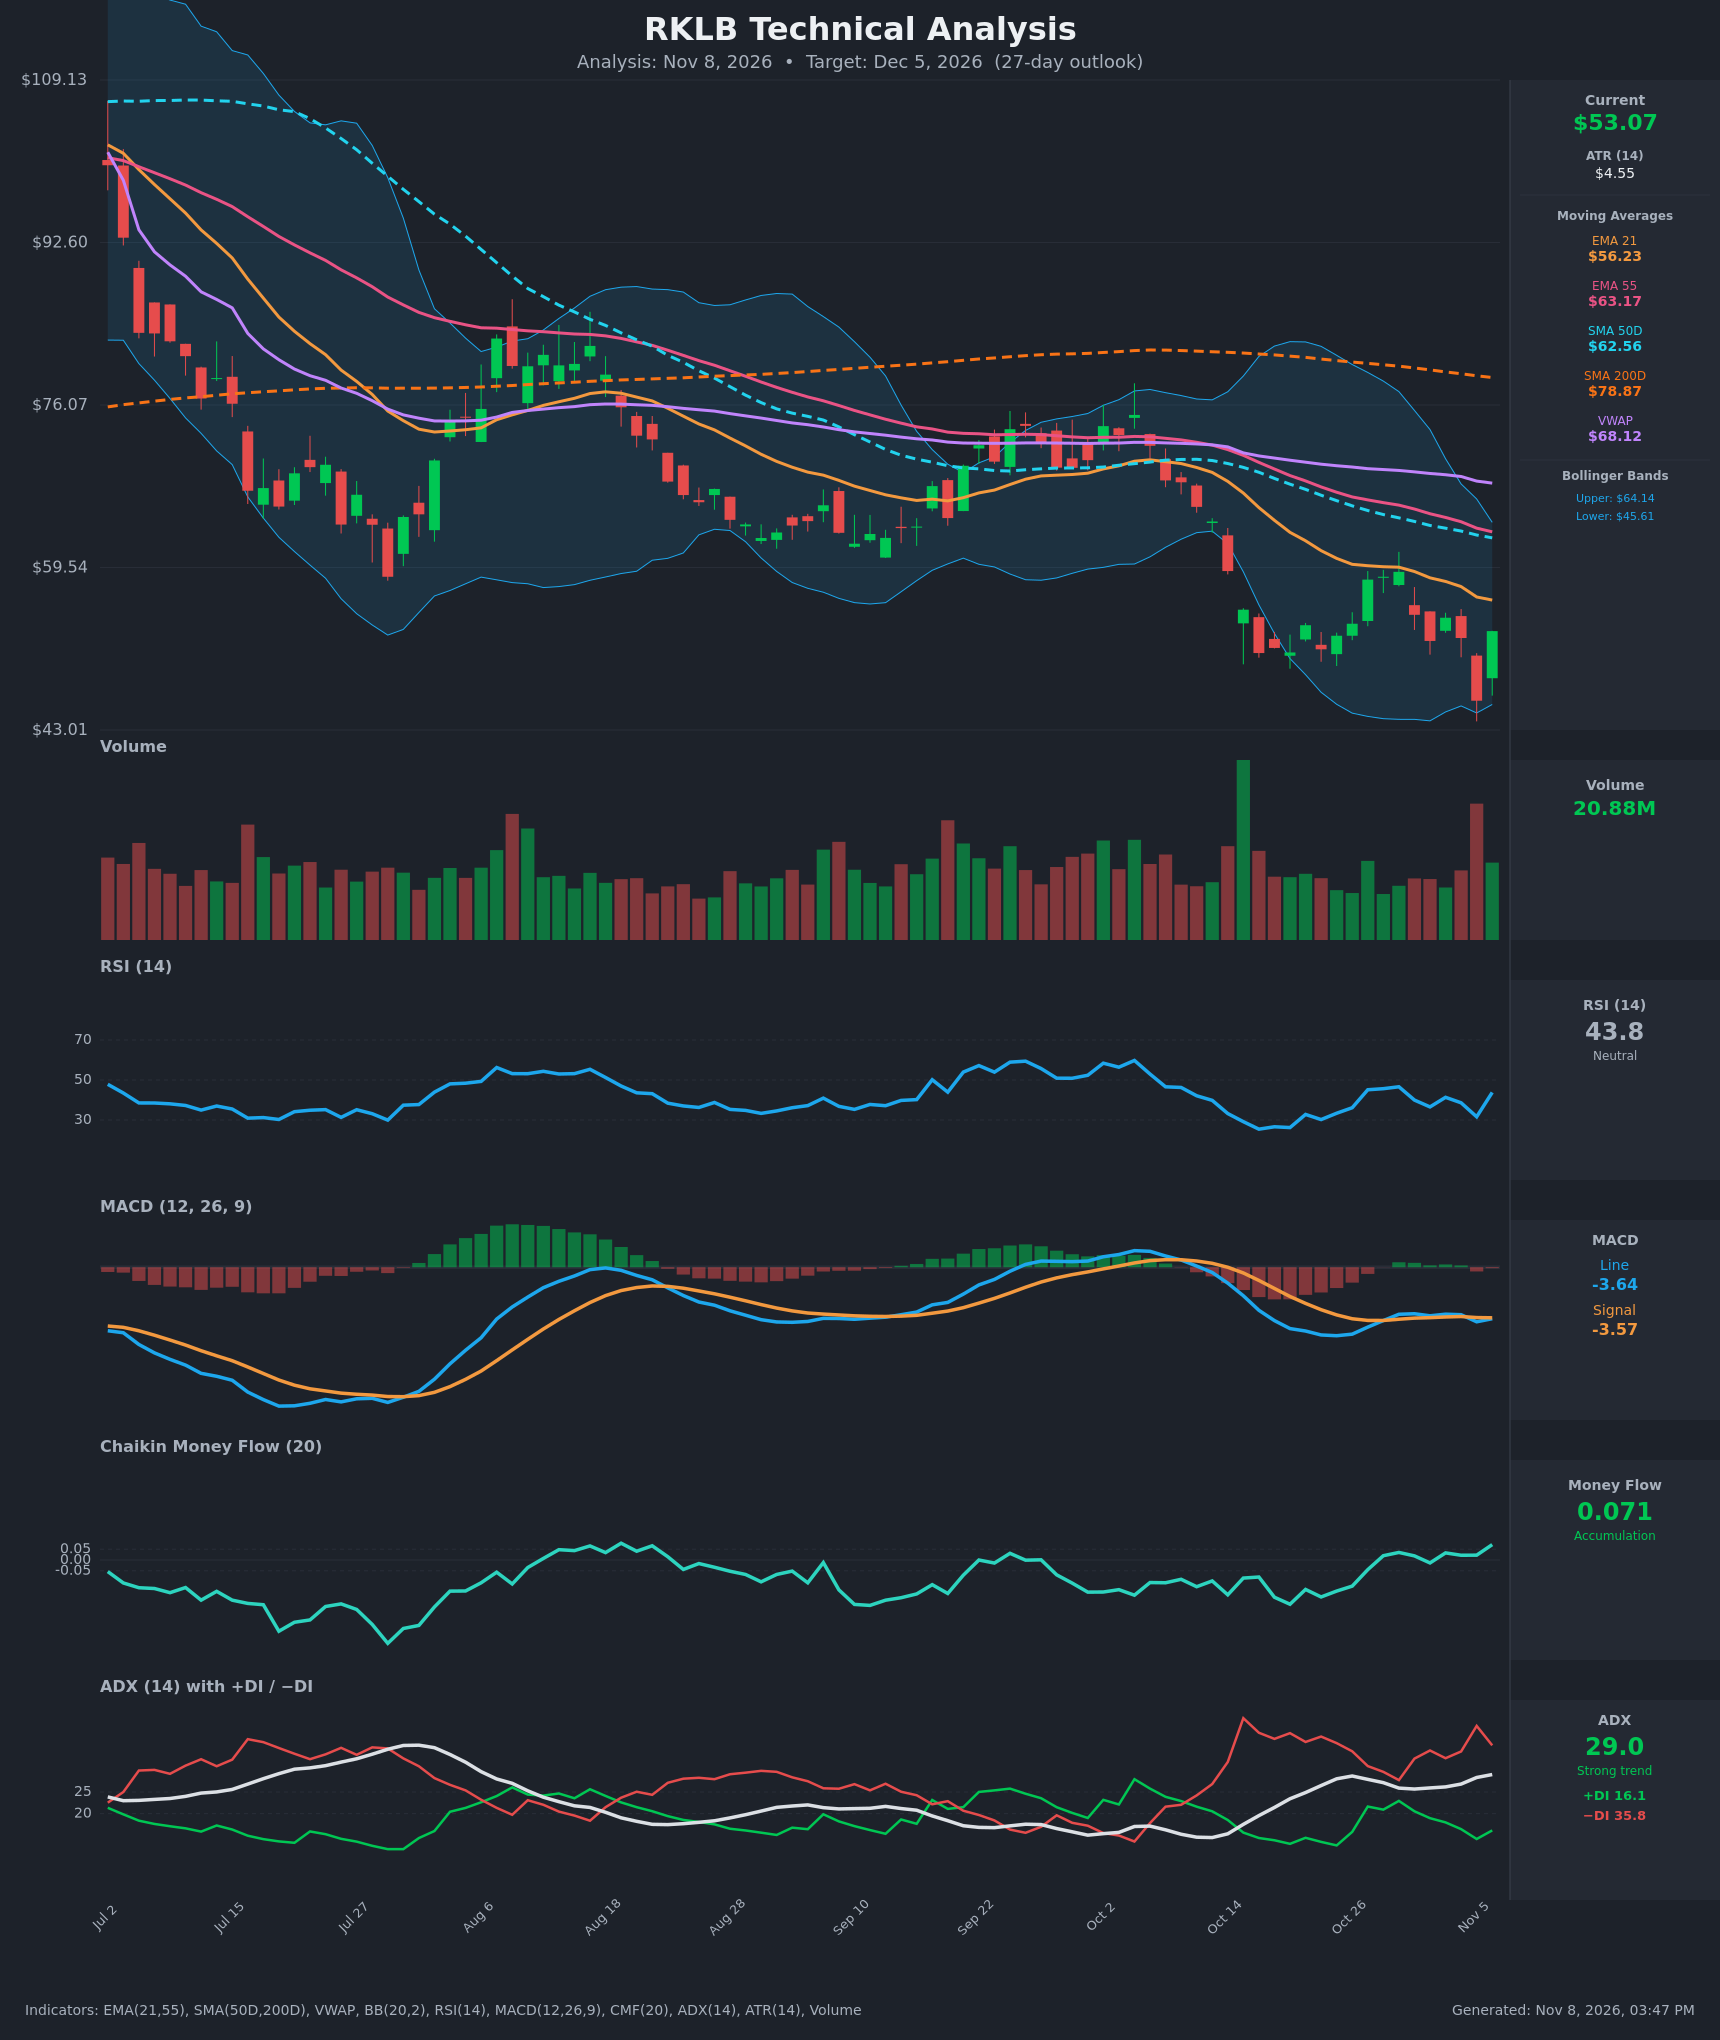
- RSI (14): 43.78, bouncing from 31.6 the prior bar and from a 26 oversold low in mid-October. It has recovered but is still below 50 and has not made a higher-high structure. Momentum is improving off the lows but remains in bearish territory. [Neutral]
- 20 EMA: The EMA 21 is $56.23, with price at $53.07 below it. The EMA 21 is sloping down and has been falling steadily, so it acts as near-term resistance. Price also sits below EMA 55 ($63.17). [Bearish]
- MACD: The line is -3.64 and the signal is -3.57, so the line sits just below the signal. The two have been entwined for about 10 sessions with a barely negative histogram. The line is deeply negative, so momentum is weak but bearish pressure is flattening. [Bearish]
- Bollinger Bands (20): Upper $64.14, lower $45.61, midline about $54.9. Price at $53.07 is slightly below the midline after tagging the lower band on Nov 5 ($45.99) and snapping back sharply. The bands are wide, reflecting high volatility. The lower-band bounce is a relief rally within a downtrend. [Neutral]
- CMF (20): +0.071, up from deeply negative readings (-0.205) in October. It has been positive since Oct 28, which suggests accumulation on the bounces and a divergence versus price making lower lows. [Accumulation]
- ADX (14): 29.0 and rising, with −DI (35.8) well above +DI (16.1). This is a strong downtrend, and bears remain in control despite the bounce. [Strong Trend – Bearish]
- Volume: 20.88M on the latest green bar after a high-volume selloff bar on Nov 5. The big volume spike at the Oct 14 breakdown and heavy volume on the Nov 5 flush point to capitulation-style activity. The latest bounce volume is decent but not decisive. [Mixed – possible capitulation bounce]
DIVERGENCES & TRENDS
- Bullish divergence: CMF has risen from -0.2 to +0.07 while price made lower lows. RSI also made a higher low (31.6 on Nov 5 vs 26.2 on Oct 20) even as price made a lower low ($45.99 vs $50.90).
- Moving average structure: Price is below EMA21, EMA55, SMA50D ($62.56), SMA200D ($78.87) and VWAP ($68.12). The stack is fully bearish. EMA21 < EMA55 and SMA50D < SMA200D (death cross in place).
- MACD: Flat and just below its signal after a failed attempt to cross in late October. There is no bullish crossover yet.
- ADX/DI: −DI dominates and ADX is climbing, so the trend is intact.
- Price action: The Nov 6 bounce (+15% from $45.99 to $53.07) was a sharp reversal off the lower Bollinger Band. It is a classic oversold snap-back, but it has not yet reclaimed EMA21.
CHART PATTERNS
- Primary pattern: A Bearish Rising Wedge/Flag-type continuation is not clearly formed. The more relevant structure is a persistent downtrend with lower highs and lower lows since July, now in a descending channel. Price has been making lower highs ($59–$59.5 in late October) and lower lows ($45.99).
- Possible bullish element: The late-October to early-November base with a sharp reversal off the lower band resembles a tentative Bullish Double Bottom (lows near $50–$51 on Oct 19–20 and a lower wick at $46 on Nov 5), but it is unconfirmed. Confirmation would need a close above the neckline near $59, with a measured move toward about $65–$68.
- Bearish continuation measured move: If the $46 low breaks, the next support is the $43 area, with extension toward the high $30s.
POTENTIAL SCENARIOS
- Scenario 1: Bearish Downtrend Resumption — The bounce stalls beneath EMA21 (~$56) and falls back toward the lower Bollinger Band. The strong ADX with −DI dominance and the fully bearish moving average stack favor trend continuation. Trigger: rejection at $56–$58 and a close below $50. Target: $44–$46, with an extension to $42. Invalidation: daily close above $59.5. (45% probability)
- Scenario 2: Neutral/Choppy Base Between $46 and $59 — A volatile range forms as the capitulation bounce digests and CMF accumulation offsets trend pressure. Trigger: holding above $48 and failing at $58. Target: $50–$56. Invalidation: close outside $46–$59. (30% probability)
- Scenario 3: Bullish Relief Rally / Double Bottom — Accumulation (CMF) and the RSI divergence drive a push through EMA21 and the Oct 29 high. Trigger: close above $59.5 on rising volume and a MACD bullish cross. Target: $63–$65 (EMA55/BB upper). Invalidation: close below $48. (25% probability)
PRICE TARGETS
Timeframe: 27 days (range width target ~12–18% of price, so roughly $6.4–$9.5; given ATR of $4.55 and high volatility, I use a width at the upper end, ~$9.50, or ~18%).
- Target Price: $51.00 (the bearish tilt reflects trend strength, with an expectation of partial retracement of the bounce)
- Expected Range: $45.00 to $59.00 (width $14.00 = ~26% of current price; this is wider than the standard 12–18% guidance but justified by ATR of $4.55 and the 15% single-day swing. The self-check against the timeframe is satisfied as it is wider than any shorter-term range.)
- Key Levels: Support at $46.00, Resistance at $56.23
OVERALL BIAS
OVERALL BIAS: BEARISH - Price remains below every major moving average with a death cross in place, ADX at 29 and rising with −DI (35.8) far above +DI (16.1), and the MACD sits below its signal. The CMF accumulation and RSI divergence argue for a volatile bounce, but the trend favors a fade of the rally beneath the EMA21 resistance near $56.
This is educational analysis and not financial advice.