QBTS 27-day bearish forecast — Nov 8, 2026
- Bias: Bearish
- Timeframe: 27 days (made Nov 8, 2026, target date Dec 4, 2026)
- Price at analysis: $10.68
- Price target: $10.00
- Expected range: $8.95 – $10.80
- Result: Pending — graded after the close on Dec 4, 2026
Get a free AI analysis of QBTS today
Analysis
TECHNICAL INDICATORS
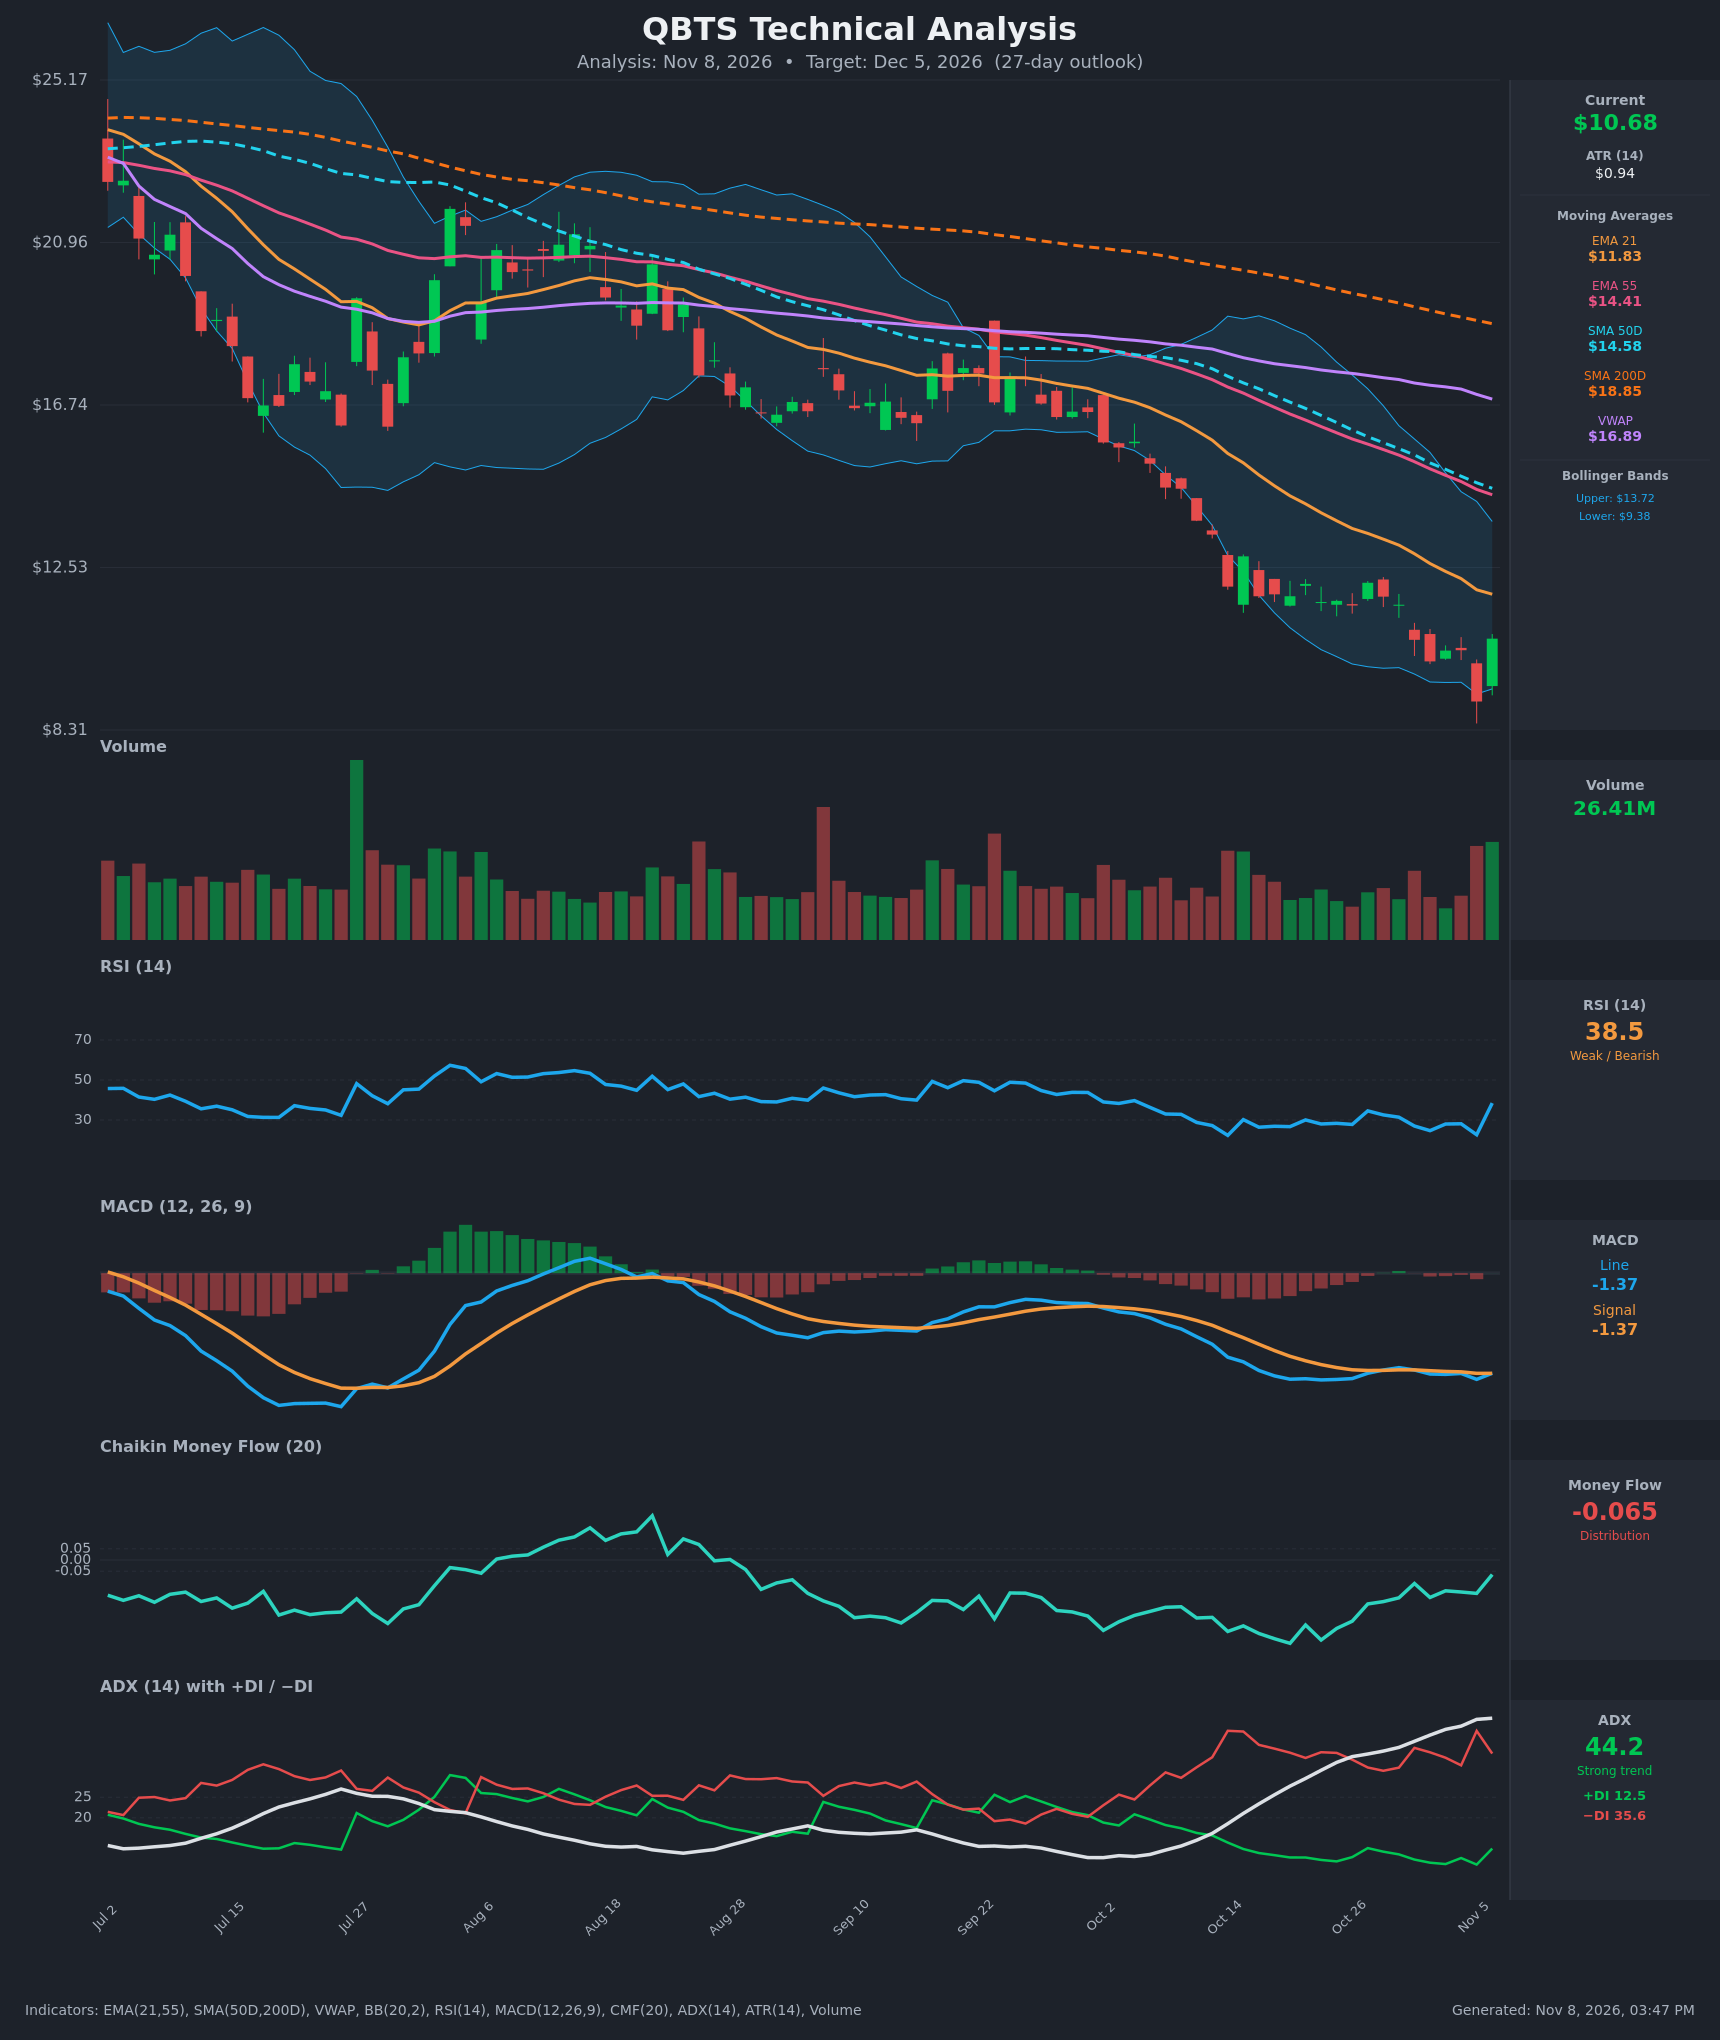
- RSI (14): 38.45, bouncing sharply from 22.6 on Nov 5 (deeply oversold) but still below 50 and under the 40-45 zone that capped earlier rebounds. Momentum is improving from an extreme, not yet turned. [Neutral]
- 20 EMA: The 21 EMA is $11.83, about 10.8% above price, and it is falling steadily (it was $14.65 on Oct 19). The 55 EMA ($14.41) is far above and also falling. Price is below both, so they act as overhead resistance. [Bearish]
- MACD: The line (-1.366) and signal (-1.367) are essentially equal, a flat convergence just below zero. The histogram is near zero after a slightly negative print on Nov 5. This is a possible momentum stall, but there is no positive crossover above zero, and both lines sit well below the zero line. [Neutral]
- Bollinger Bands (20): Upper $13.72, lower $9.38, midline about $11.55. Price closed at $10.68 after Nov 5 pierced the lower band (close $9.05). It is back inside the bands but below the midline. The bands are still wide and sloping down, so the trend remains down and the move is a snap-back from a band-walk. [Bearish]
- CMF (20): -0.065, just under the -0.05 distribution threshold. It has improved from -0.35 on Oct 19 but remains negative, so selling pressure is easing without any accumulation yet. [Distribution]
- ADX (14): 44.2 and rising, with -DI (35.6) far above +DI (12.5). This is a very strong downtrend. ADX above 40 can also flag a mature or exhausted move, and -DI has dipped from 41.1 to 35.6 on the bounce. [Strong Trend – Bearish]
- Volume: 26.41M on the Nov 6 reversal candle, among the highest in the visible window. It is a high-volume green bar after a capitulation-style drop (Nov 5). That could mark a selling climax, but one bar is not confirmation. [Bullish short-term reversal attempt within a bearish trend]
DIVERGENCES & TRENDS
- No clean bullish divergence: Nov 5 made a lower low in price ($9.05 vs $10.09) and a lower RSI low (22.6 vs 24.7). Momentum confirmed the low instead of diverging.
- MACD flattening: The MACD line has stopped falling and is hugging the signal line (-1.37 vs -1.37). It has been flat in the -1.3 to -1.4 range for about 3 weeks, so downside momentum is stalling but has not reversed.
- MA structure:
- Death-cross structure is in place: SMA50D ($14.58) is far below SMA200D ($18.85), and EMA21 is below EMA55.
- Price is below VWAP ($16.89) and below every moving average, a textbook long-term downtrend.
- Trend indicators: ADX has risen from 25.6 to 44.2 in 15 bars with -DI dominant. +DI and -DI have not crossed.
- CMF: It has stayed negative for months and has only recently recovered toward neutral.
- Gap-down structure: The Oct 14-15 drop was followed by a small consolidation at $11.5-12.2, which then broke lower. Rebounds have been sold into repeatedly (Oct 21 and Oct 27 peaks near $12.1).
CHART PATTERNS
- Bearish Flag / Pennant (continuation): After the sharp Oct 14-15 leg down, price consolidated sideways at $11.5-12.2 and broke down, resolving in line with the prior trend. The measured move points to the $8.50-9.00 area, which is where price hit on Nov 5.
- Possible Bullish Falling Wedge / Double Bottom attempt (reversal): Nov 5 swept under the lower band and Nov 6 recovered about 18% on heavy volume. A reversal would need a close above $11.83 (EMA21) and the $12.1-12.2 swing highs, which has not happened.
- Verdict: The dominant read is a downtrend continuation, with the Nov 6 bounce most likely a relief rally into resistance. The first overhead hurdles are $11.55 (BB mid) and $11.83 (EMA21).
POTENTIAL SCENARIOS
- Scenario 1: Bearish Relief Rally Fails, Trend Resumes — The bounce stalls beneath the BB midline and 21 EMA. Sellers defend the $11.5-12.2 area, the same zone that held through late October, and price rolls over to retest or break the Nov 5 low. Trigger: rejection at $11.55-11.83, or a daily close back below $10.00. Target: $9.05, then $8.50 on a break. Invalidation: daily close above $12.20. (50% probability)
- Scenario 2: Bullish Capitulation Reversal — The high-volume Nov 5-6 candles mark a selling climax. Oversold RSI and a stalled MACD fuel a mean-reversion rally toward the declining 21 EMA and upper Bollinger Band. Trigger: close above $11.83 with volume holding. Target: $12.80-13.70 (upper BB, prior breakdown zone). Invalidation: close below $9.05. (33% probability)
- Scenario 3: Neutral Base-Building Chop — Price oscillates between $9.40 and $11.60 as the market digests the sharp drop. Trigger: failure to break either $11.83 or $9.05 for several weeks. Target: about $10.30-10.70. Invalidation: close outside the $9.05-$11.83 range. (17% probability)
PRICE TARGETS
- Target Price: $10.00 (27-day outlook, Dec 5, 2026)
- Expected Range: $8.95 to $10.80 (width $1.85, about 17.3% of the current price, in line with the 27-day guidance)
- Key Levels: Support at $9.05, Resistance at $11.83
OVERALL BIAS
OVERALL BIAS: BEARISH - Price sits below every moving average and VWAP, with ADX at 44 and -DI dominating (35.6 vs 12.5), and CMF still in distribution. The Nov 6 bounce into overhead resistance at $11.55-11.83 looks like a relief rally, though conviction is modest because oversold RSI, high-volume reversal action and a stalled MACD leave real room for a bigger bounce.
This is educational analysis and not financial advice.