PLTR 27-day bearish forecast — Nov 8, 2026
- Bias: Bearish
- Timeframe: 27 days (made Nov 8, 2026, target date Dec 4, 2026)
- Price at analysis: $160.38
- Price target: $152.50
- Expected range: $142.00 – $164.00
- Result: Pending — graded after the close on Dec 4, 2026
Get a free AI analysis of PLTR today
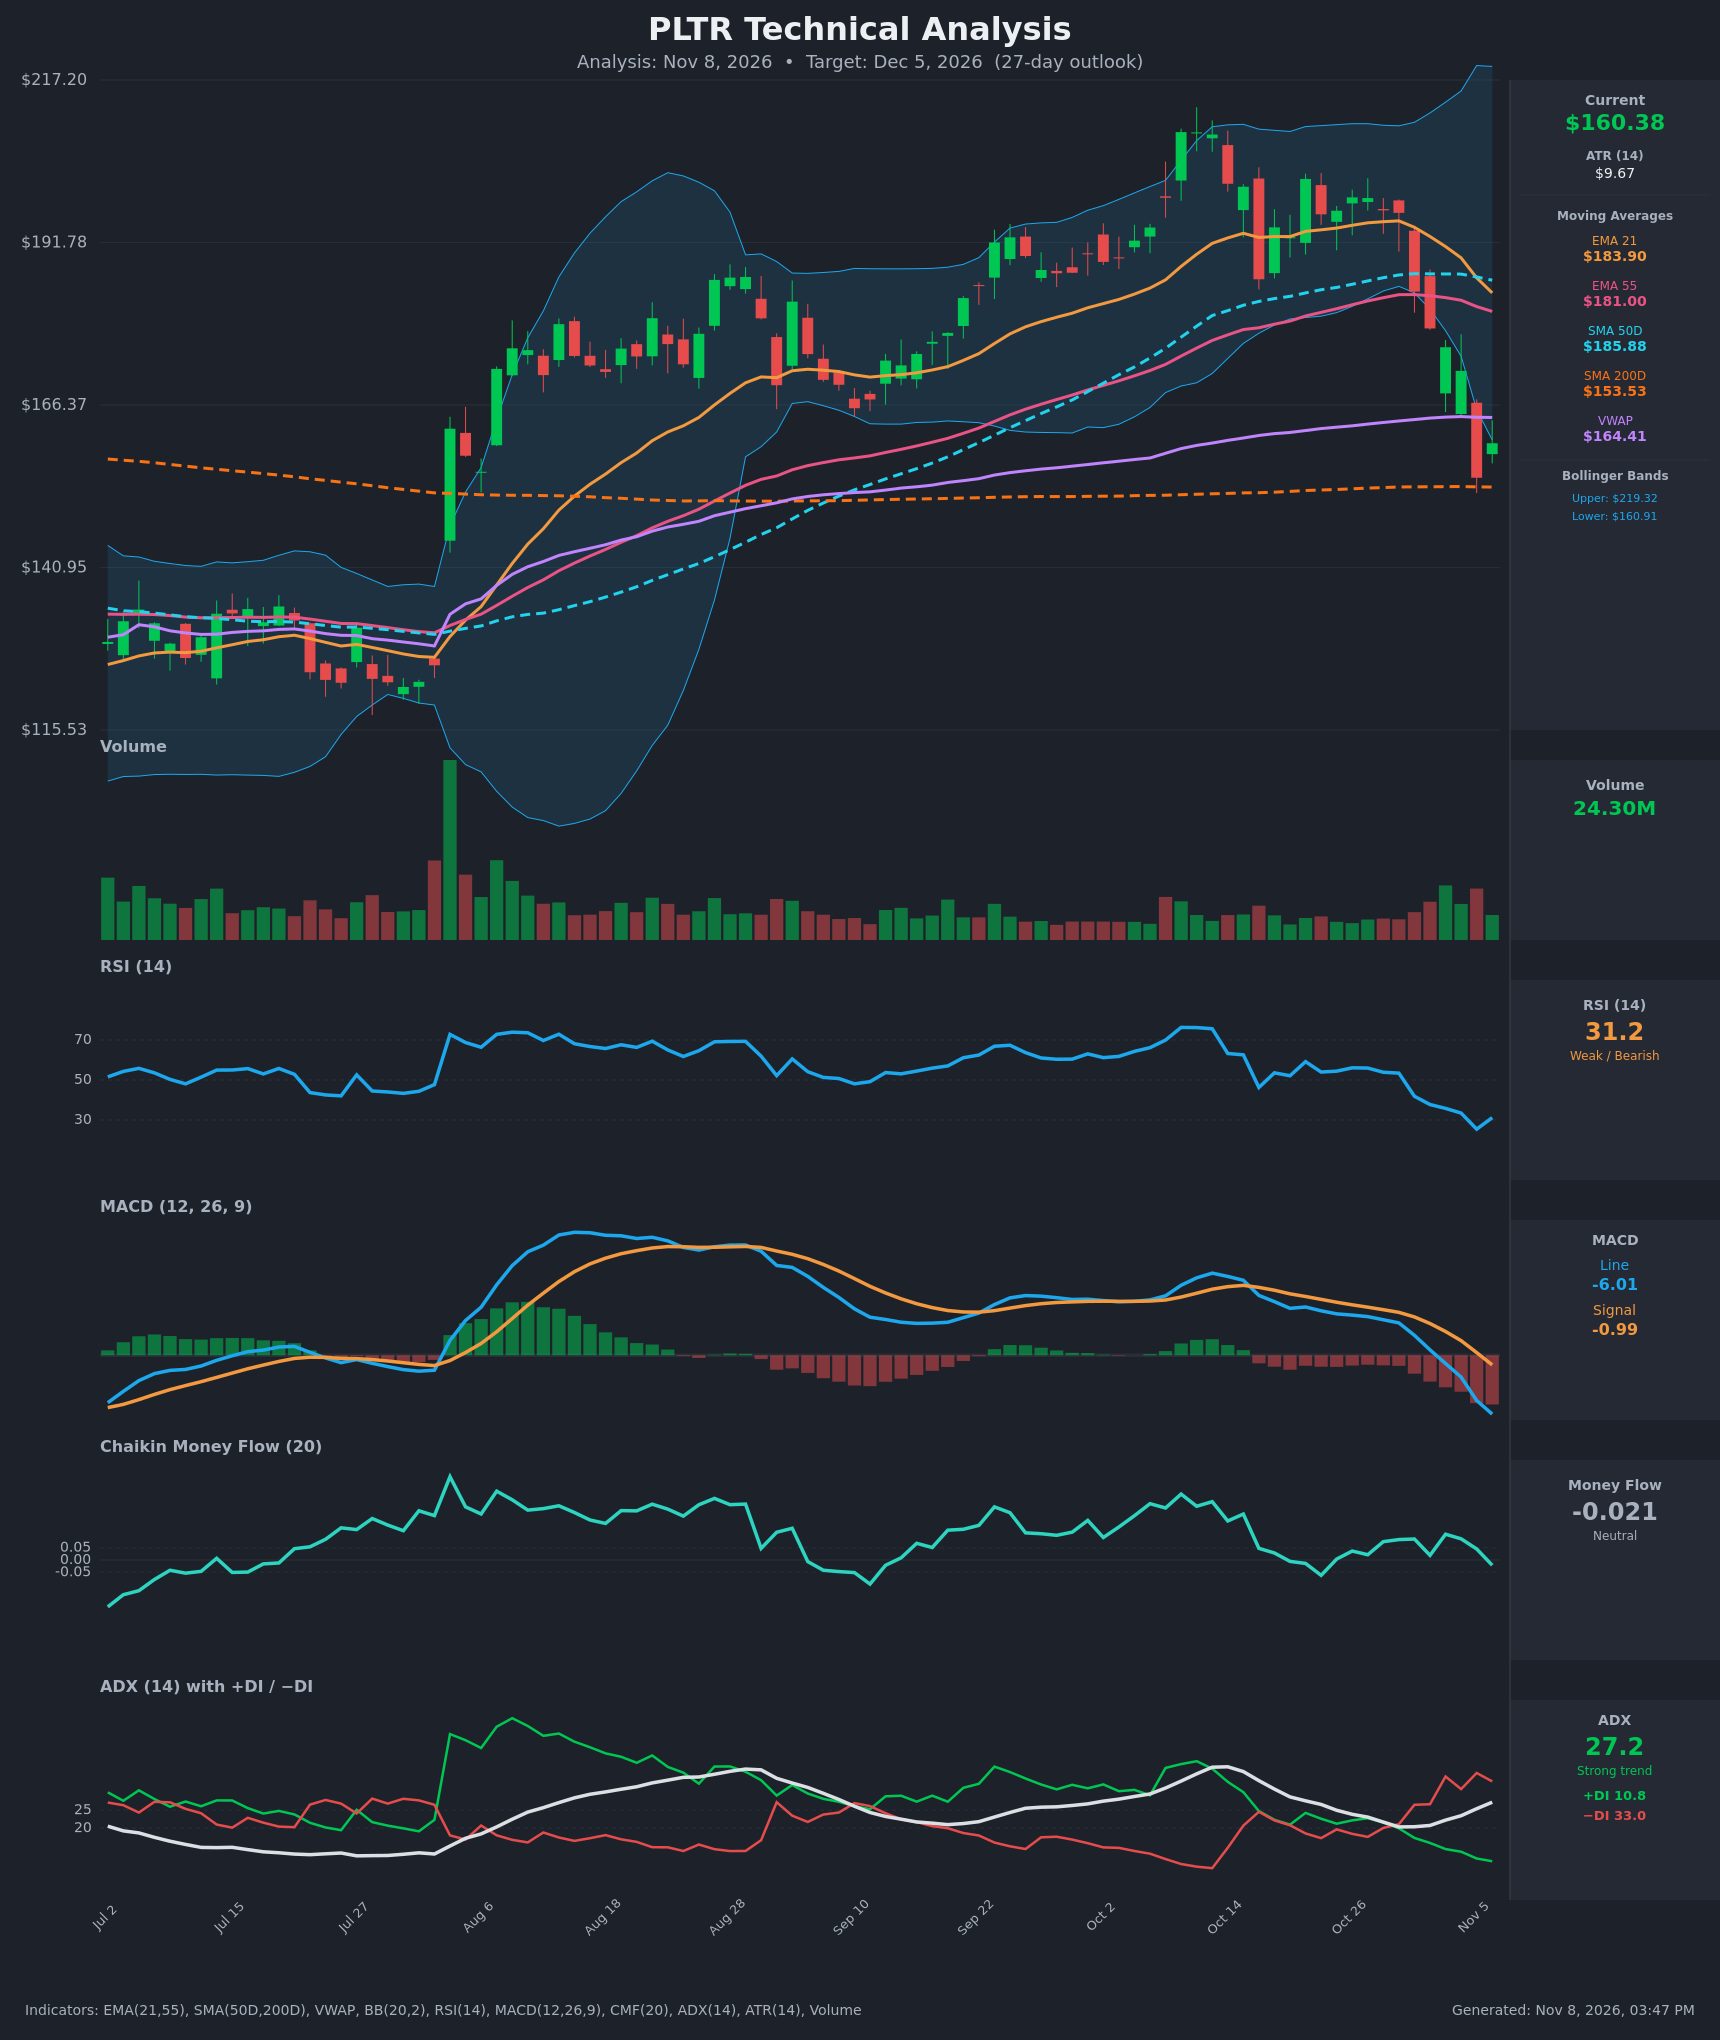
Analysis
TECHNICAL INDICATORS
- RSI (14): 31.17, down from about 54 on Oct 29 and a 25.4 low on Nov 5. The small bounce to 31 leaves it at the edge of oversold, with momentum still pointing down. Oversold readings can persist in a strong downtrend. [Bearish]
- 20 EMA: The tracked EMA 21 is $183.90, and price at $160.38 is about 13% below it. It is falling fast, from $195 on Oct 29, and now acts as overhead resistance. EMA 21 is also converging on EMA 55 ($181.00), so a bearish EMA cross is imminent. [Bearish]
- MACD: Line -6.01 is below signal -0.99, and the histogram is increasingly negative. The line dropped below zero on Nov 3 and has accelerated down since. The momentum signal is clearly bearish but stretched. [Bearish]
- Bollinger Bands (20): Price at $160.38 sits just below the lower band ($160.91), with the upper band at $219.32. The bands are wide after the volatile run to about $210. A close below the lower band shows strong downside momentum, but it also raises the odds of a mean-reversion bounce. [Bearish]
- CMF (20): -0.021, inside the neutral band (±0.05). It has faded from about +0.10 in early November, so buying pressure has dried up. There is no heavy distribution yet. [Neutral]
- ADX (14): 27.2 and rising, with −DI (33.0) far above +DI (10.8). The −DI crossover came on Oct 30. A rising ADX above 25 confirms a strong, established downtrend. [Strong Trend – Bearish]
- Volume: 24.30M on the latest bar, with the Nov 5 breakdown candle on elevated volume. Heavier volume on the decline than on the prior low-volume grind higher points to real selling. A small green candle on Nov 6 is not yet confirmation of a bounce. [Bearish on the selloff, bounce unconfirmed]
DIVERGENCES & TRENDS
- No bullish divergence yet. RSI made a new low (25.4) alongside the price low on Nov 5, and MACD and ADX are still deteriorating. A bounce would need a higher RSI low to signal a divergence.
- Moving averages: EMA 21 has dropped from $195 to $183.90 in about 7 sessions and is nearing a cross below EMA 55. SMA 50D ($185.88) is rolling over. SMA 200D ($153.53) is rising slowly and is the key long-term support, just 4% below price. There is no death cross, because SMA 50D is still well above SMA 200D.
- VWAP: Price is below VWAP ($164.41), so sellers control the near term. VWAP is the first resistance on any bounce.
- Trend change: The price has gone from a series of higher highs (peak near $207-210 in mid-October) to a sharp reversal. The sequence is lower highs near $200, then a break of the Sep-Oct support near $166-170, then a roughly 10% down bar on Nov 5. This is a clear bearish character change.
- Key breaks: MACD below zero, price below both EMAs, SMA 50D and VWAP, and the lower Bollinger Band breached.
CHART PATTERNS
- Bearish Double Top / broad topping structure: Two peaks near $200-210 in mid-to-late October, with the neckline in the $166-170 area from the September lows. The Nov 4-5 drop broke the neckline decisively. The classic measured move (peak ≈ $207 minus neckline ≈ $167 = about $40) projects toward $127. That is a longer-horizon target and is unlikely to be fully reached in 27 days.
- Neckline retest risk: Pullbacks to the broken neckline and VWAP area ($164-170) often fail, as in the reference diagram's bearish reversal patterns.
- Support: SMA 200D at $153.53 aligns with the early-August breakout base around $150-155, which makes it a strong confluence zone. The 27-day outlook is likely a test of this level, with a hold-or-break decision.
POTENTIAL SCENARIOS
- Scenario 1: Bearish Continuation to SMA200 Test — Price fails at the VWAP / broken neckline zone ($164-170), then grinds lower with −DI dominant and MACD still falling. The EMA 21/55 bearish cross adds pressure. Trigger: rejection at $164-170 and a daily close below $158. Target: $150-153, with a possible wick to $145. Invalidation: daily close above $176. (45% probability)
- Scenario 2: Bullish Oversold Relief Bounce — RSI near 30 and a Bollinger Band tag spark a mean-reversion rally. Price reclaims VWAP and runs toward the falling EMAs, then likely stalls there. Trigger: close above $164.41 with rising volume and an RSI higher low. Target: $175-184 (EMA 21/55 zone). Invalidation: close back below $155. (30% probability)
- Scenario 3: Bearish Breakdown Below SMA200 — The $153.5 support fails on heavy volume and the double-top measured move begins to play out. Trigger: daily close below $152 with ADX above 30. Target: $135-140. Invalidation: reclaim of $153.5 and then $160. (25% probability)
PRICE TARGETS
- Target Price: $152.50 (27-day horizon)
- Expected Range: $142.00 to $164.00 (width $22.00, about 13.7% of the current price, consistent with a ~27-day horizon)
- Key Levels: Support at $153.53 (SMA 200D), Resistance at $164.41 (VWAP)
OVERALL BIAS
OVERALL BIAS: BEARISH - Price broke down from a double-top structure with MACD below zero, −DI far above +DI with ADX rising above 25, and price below all key short-term averages and VWAP. Oversold RSI and the SMA 200D support near $153.5 argue for a bounce risk, but the weight of evidence favors a test of that support.
This is educational analysis and not financial advice.