SOXS 27-day bearish forecast — Nov 8, 2026
- Bias: Bearish
- Timeframe: 27 days (made Nov 8, 2026, target date Dec 4, 2026)
- Price at analysis: $70.95
- Price target: $60.00
- Expected range: $54.00 – $67.00
- Result: Pending — graded after the close on Dec 4, 2026
Get a free AI analysis of SOXS today
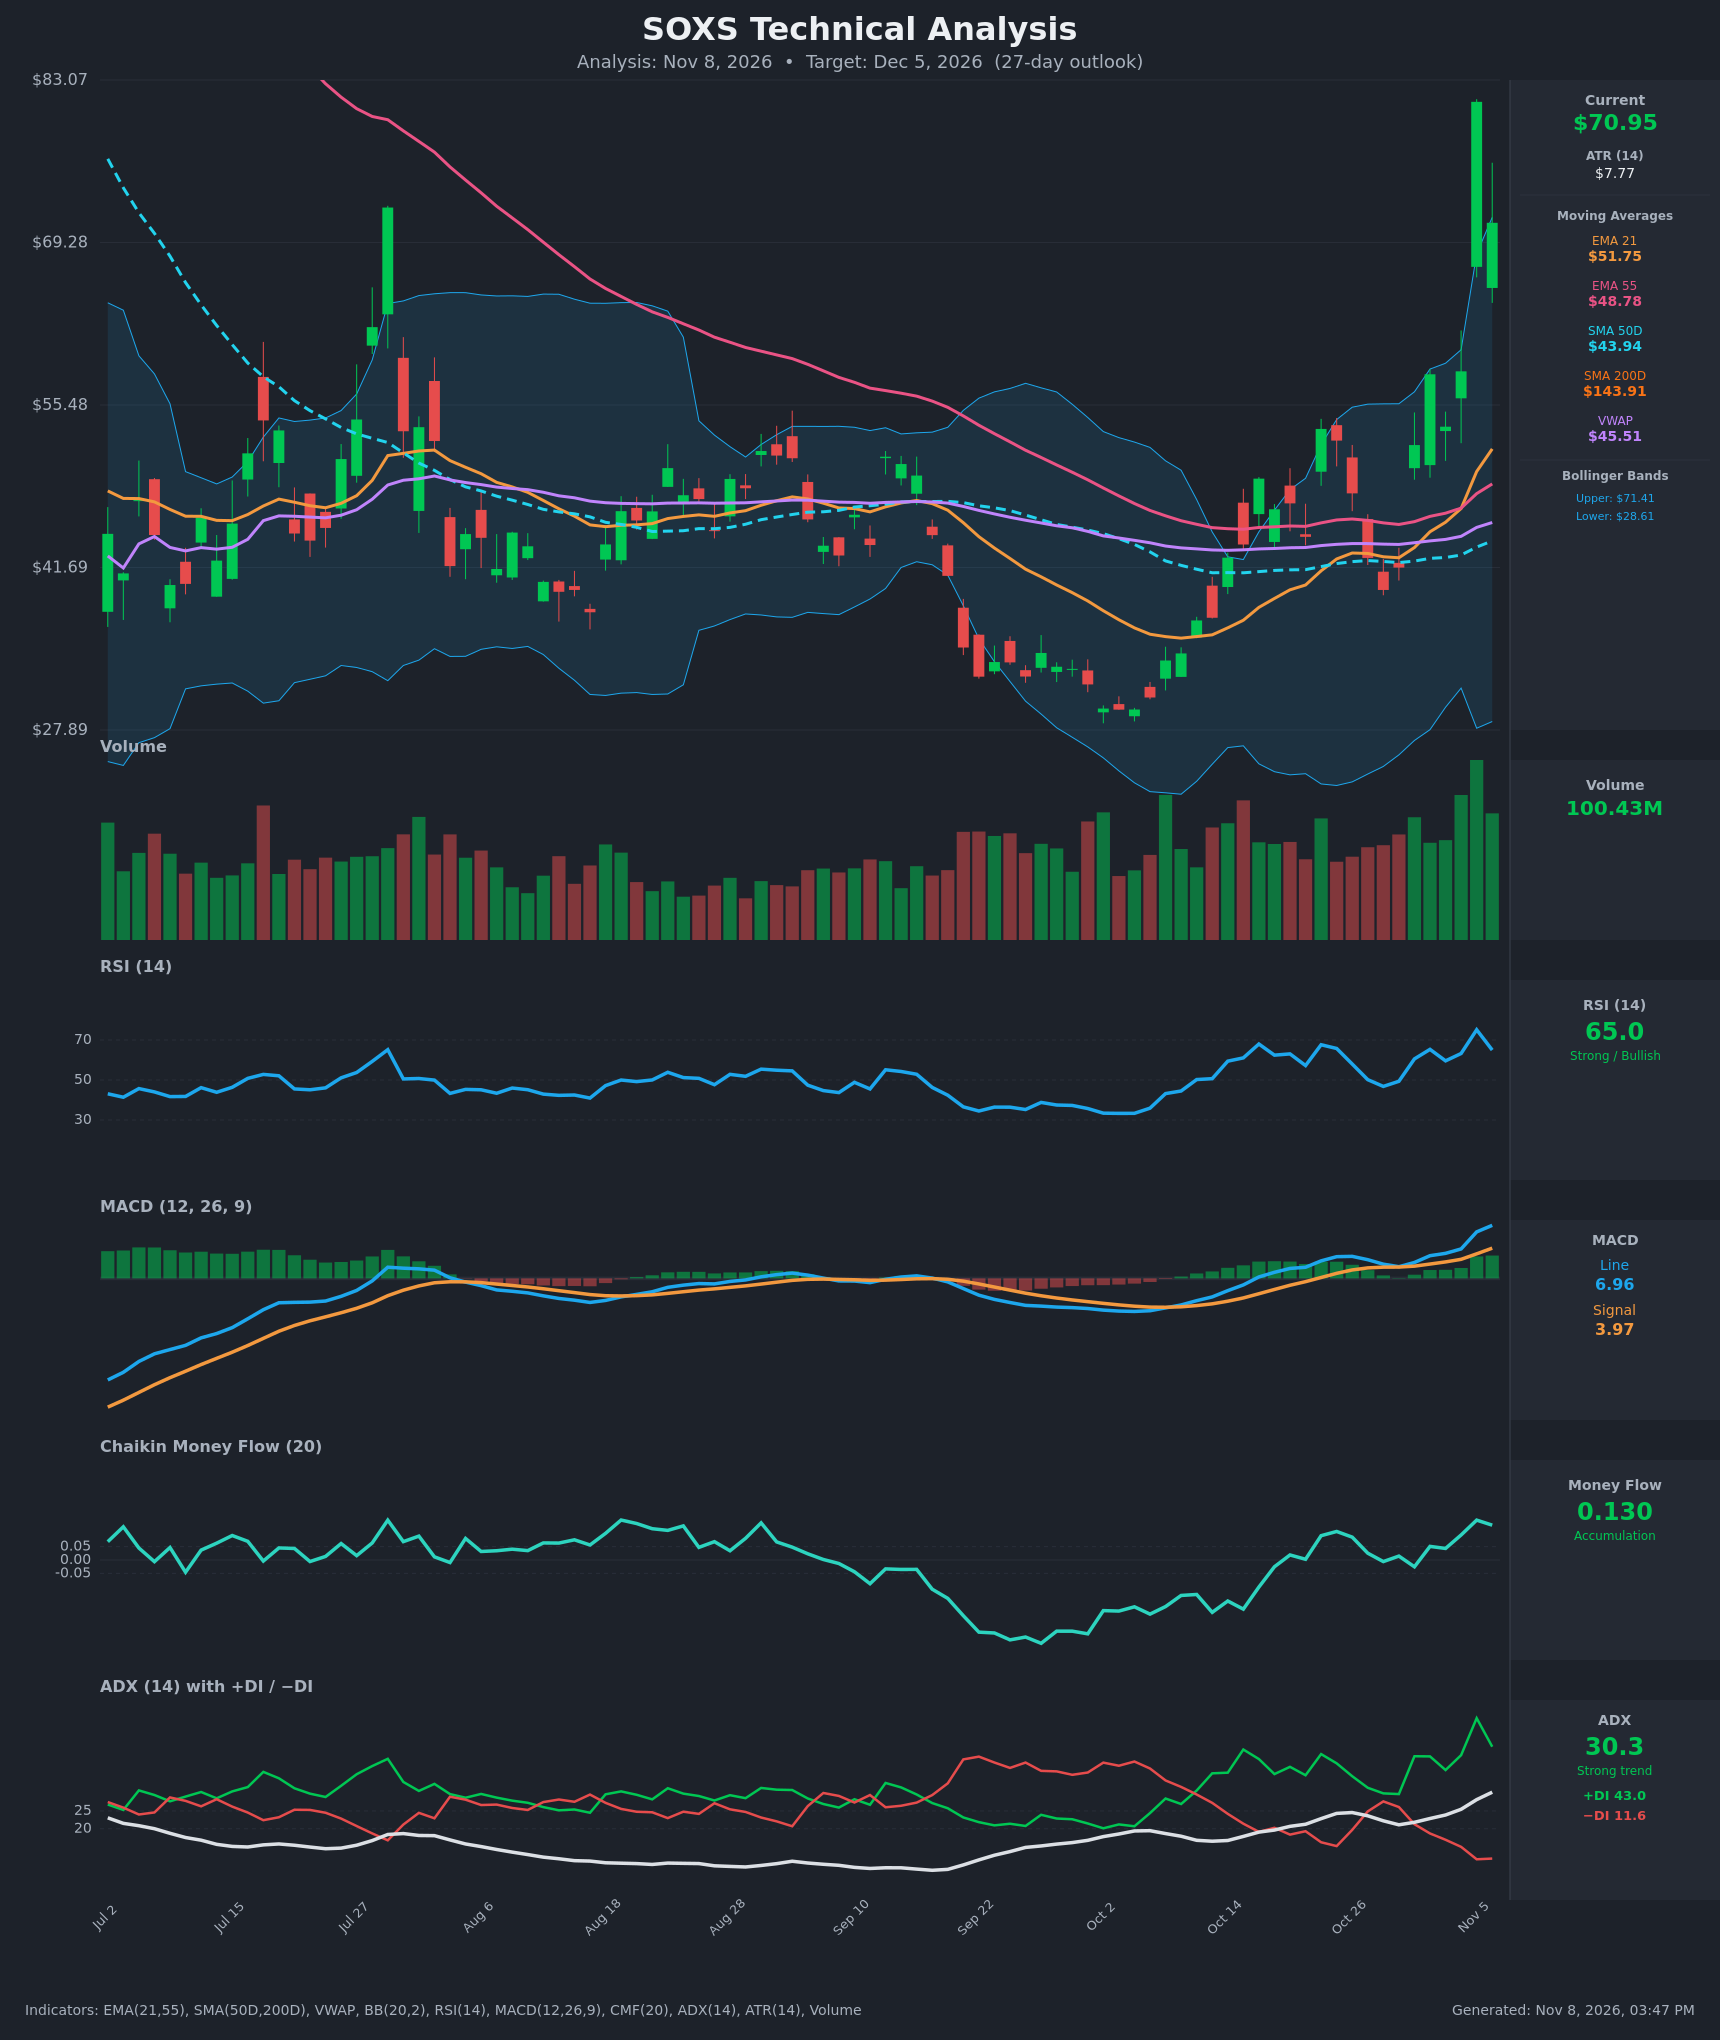
Analysis
TECHNICAL INDICATORS
- RSI (14): 64.97, down from 75.1 on Nov 5. It touched overbought on the spike and is now rolling over, so upside momentum is fading from an extreme. [Neutral]
- 20 EMA: The 21 EMA is $51.75 and price ($70.95) is about 37% above it. EMA21 has crossed above EMA55 ($48.78), which is a bullish crossover. But the stretch from the mean is extreme and prone to reverting. [Bullish]
- MACD: The line (6.96) is above the signal (3.97), and the histogram is positive and expanding. The bullish crossover happened on Oct 22 and momentum is still accelerating. Momentum indicators lag a one-day spike like this. [Bullish]
- Bollinger Bands (20): Upper band $71.41, lower band $28.61. Price is pinned at the upper band after the bands widened sharply, which is a very extended reading. A close back inside the band after a spike above it, as in late July, has often preceded mean reversion. [Bearish]
- CMF (20): 0.130, above the +0.05 threshold and rising since early October, so buying pressure is solid. [Accumulation]
- ADX (14): 30.3 and rising, with +DI at 43.0 versus −DI at 11.6. This is a strong uptrend, though +DI has already peaked at 51.0 and is falling. [Strong Trend – Bullish]
- Volume: 100.43M, the second-highest bar on the chart, behind the Nov 5 climax volume. The spike came on heavy volume but was followed by a –12.6% reversal, which looks like blow-off or exhaustion behavior. [Climactic / Bearish-leaning]
DIVERGENCES & TRENDS
- Price closed at $81.22 on Nov 5, then fell 12.6% to $70.95 the next day. The upper wick on the last candle shows rejection near $81.
- RSI made a lower reading (65.0) after peaking at 75.1, and +DI has turned down from 51.0 to 43.0. Together they point to early momentum rollover.
- MACD and ADX are still rising, so the trend structure is intact. The trend indicators lag price, and the oscillators are turning first.
- Price is above EMA21, EMA55, SMA50D ($43.94) and VWAP ($45.51), so the short-term trend is up. It remains far below SMA200D ($143.91), and the death cross (SMA50D below SMA200D) is long since in place, so the long-term trend is down.
- The previous spike in late July (about $72) was followed by a drop back to the low $40s and then the high $20s. A similar spike-and-fade is a plausible template.
- SOXS is a 3x inverse leveraged ETF, so volatility decay and mean reversion after a vertical spike are structural headwinds.
CHART PATTERNS
- No clean pattern from the reference diagram fits. The recent action is a vertical spike followed by a pullback, which is closest to a short-term blow-off top.
- Two long-term patterns are visible. The long base from August to October, around $29–$42, resembles a loose Bullish Triple Bottom / range base. Its breakout is what produced the move higher.
- The measured move is largely complete. Pattern height is roughly $42 – $29 = $13, projecting to about $55 from the breakout, and price has already overshot that by a wide margin.
- A pullback toward the prior breakout area ($52–$58, near EMA21 and the Nov 2–4 closes) is the typical retest behavior.
POTENTIAL SCENARIOS
- Scenario 1: Bearish Blow-off Mean Reversion — The Nov 5 spike marks an exhaustion high. Price fades from the upper Bollinger Band toward the Nov 2–4 closes and the rising EMA21. Trigger: a daily close below $64–$65 and the MACD histogram starting to shrink. Target: $58–$60, with an extension toward $52 (EMA21). Invalidation: a daily close above $81.22. (50% probability)
- Scenario 2: Bullish Trend Continuation — The strong ADX and +DI dominance keep the uptrend going, and price consolidates then breaks to new highs. Trigger: a close above $75 with expanding volume. Target: $81–$90. Invalidation: a close below $58. (35% probability)
- Scenario 3: Neutral High-Level Consolidation — Price chops between $58 and $75 as the indicators cool. Trigger: a daily range contraction with the MACD histogram flattening. Target: $63–$70. Invalidation: a close outside $55–$78. (15% probability)
PRICE TARGETS
- Target Price: $60.00 (27-day horizon, about 15% below current)
- Expected Range: $54.00 to $67.00 (width $13 ≈ 18% of current price, in line with the 27-day timeframe guidance, which sits between the 14–21 day and 30–60 day bands)
- Key Levels: Support at $58.00 (the Nov 2 close and the pullback base), Resistance at $81.22 (the Nov 5 spike high). A pop above $71.41, the upper Bollinger Band, would be the first sign of strength.
OVERALL BIAS
OVERALL BIAS: BEARISH - Price is extremely extended: 37% above EMA21, pinned at the upper Bollinger Band, and rejected from $81 on climactic volume. RSI and +DI are rolling over, and a similar July spike faded. The trend indicators (ADX, MACD, CMF) remain bullish, which is why the conviction is only moderate, but mean reversion toward $60 is the more probable outcome for this leveraged inverse ETF.
This is educational analysis and not financial advice.