SOXL 27-day bearish forecast — Nov 8, 2026
- Bias: Bearish
- Timeframe: 27 days (made Nov 8, 2026, target date Dec 4, 2026)
- Price at analysis: $45.97
- Price target: $42.50
- Expected range: $39.00 – $47.00
- Result: Pending — graded after the close on Dec 4, 2026
Get a free AI analysis of SOXL today
Analysis
TECHNICAL INDICATORS
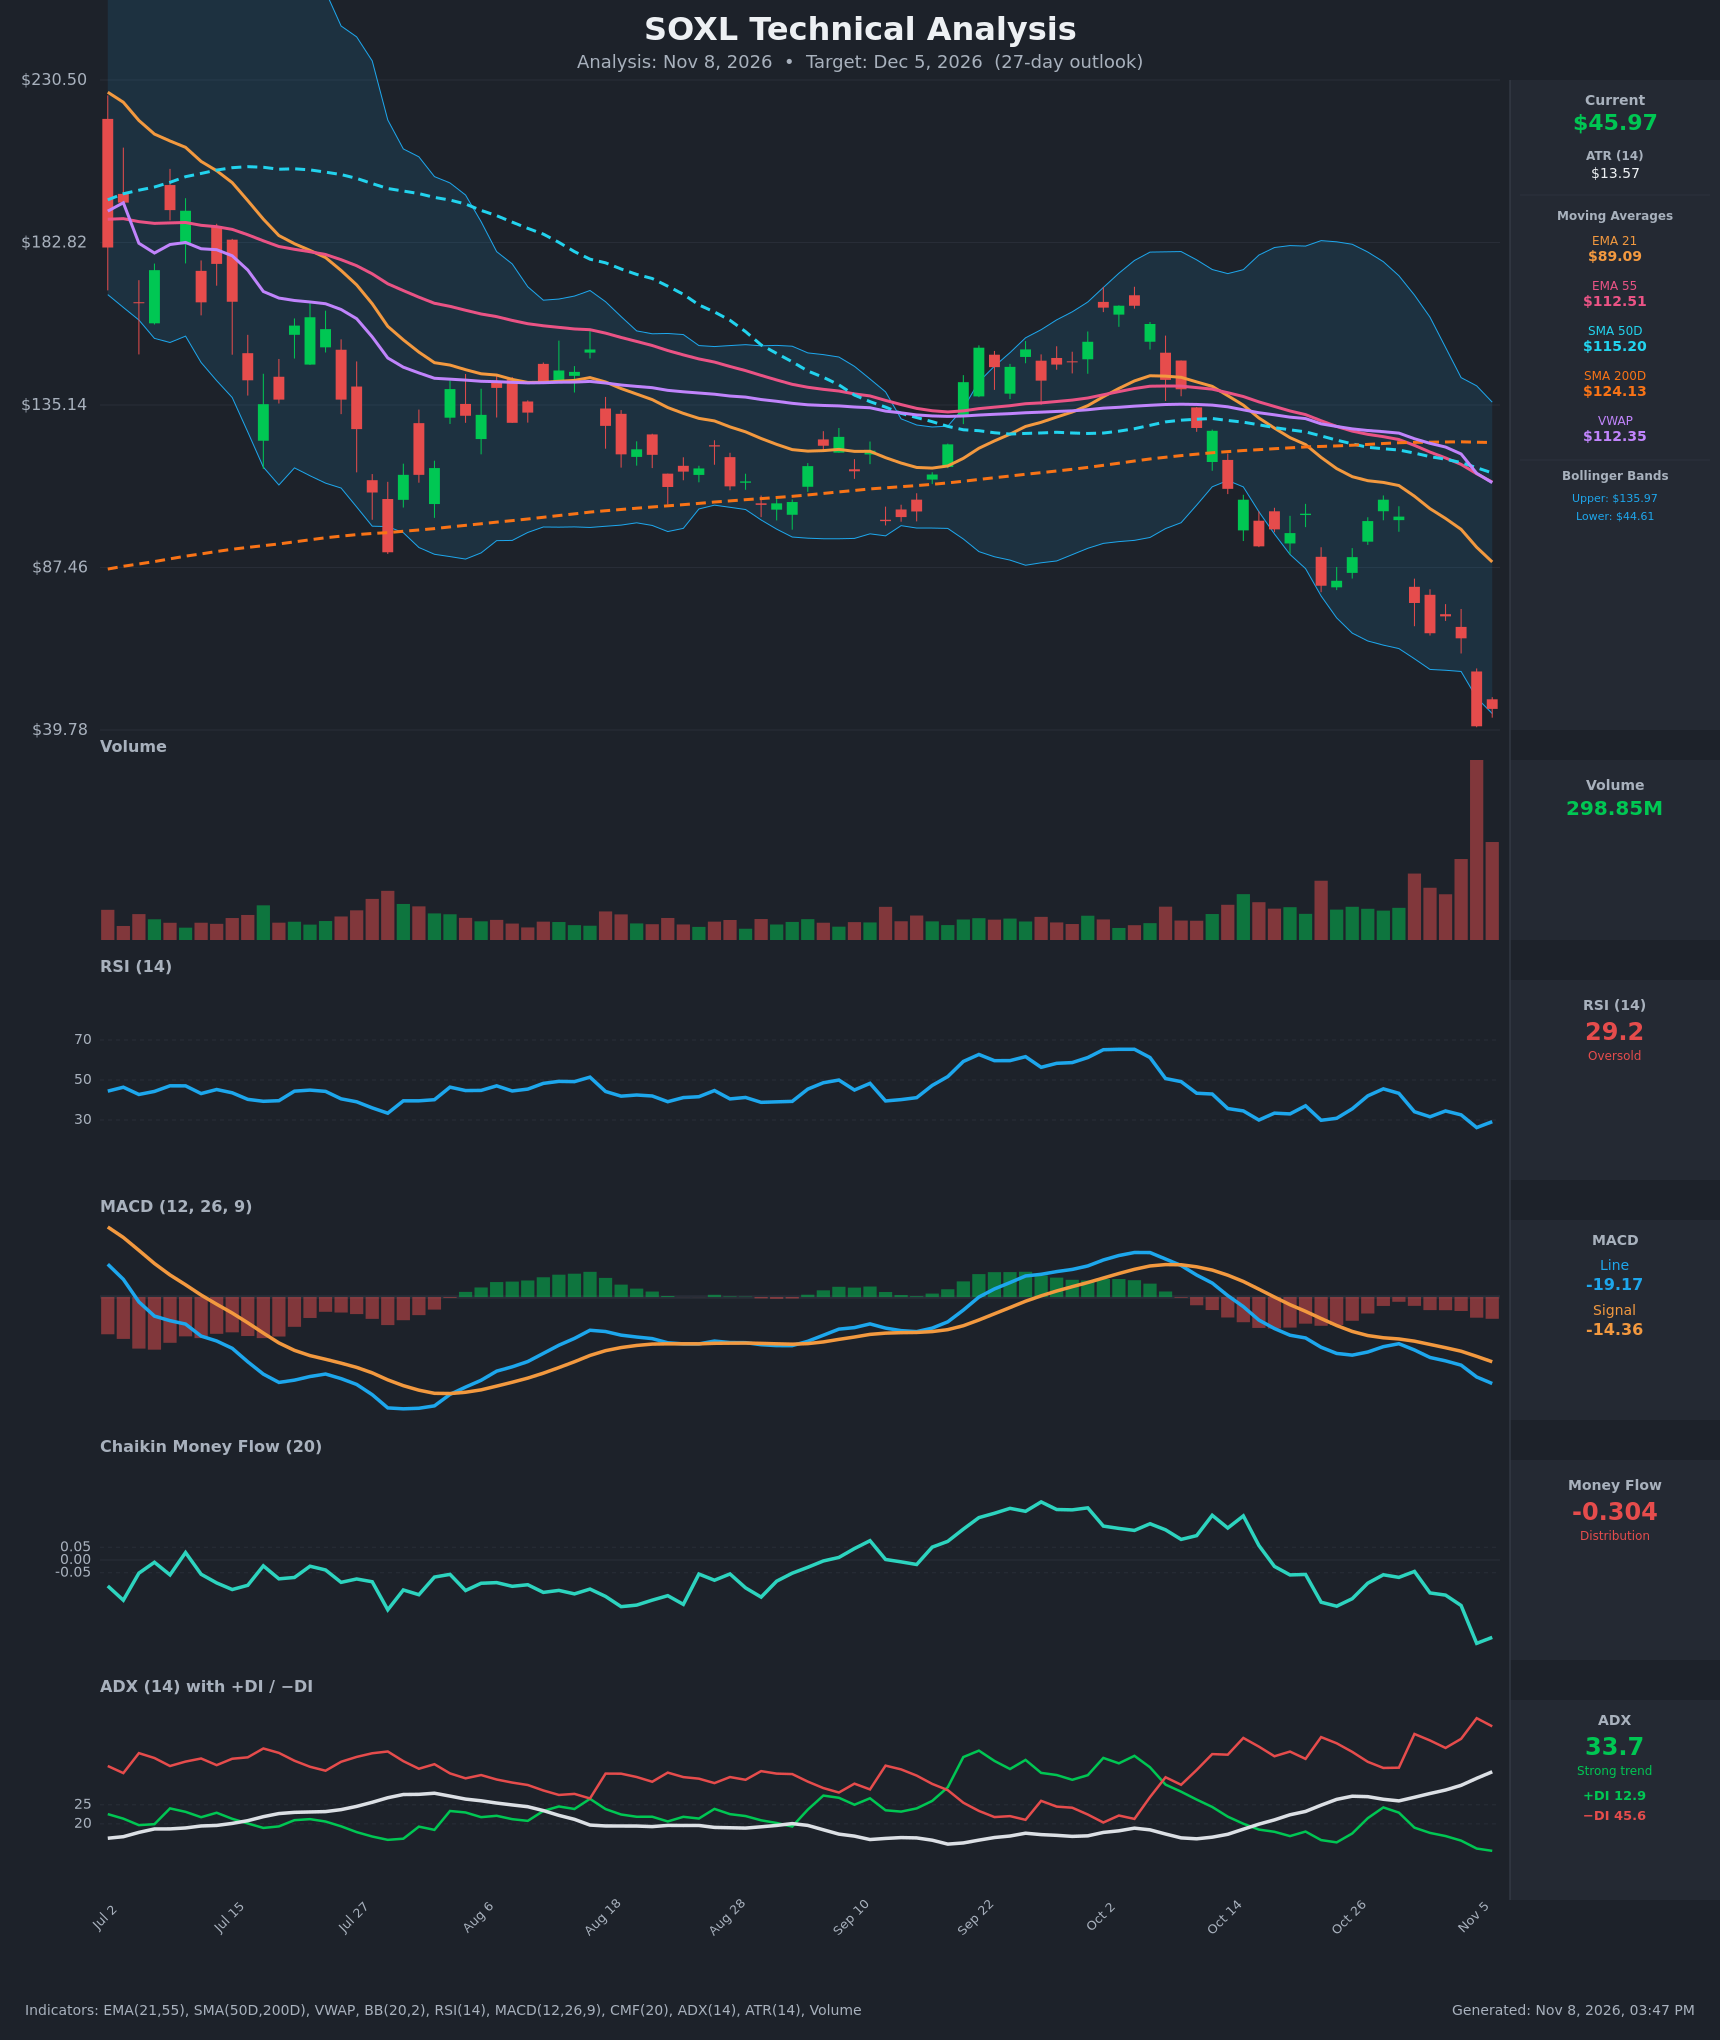
- RSI (14): 29.16, in oversold territory and near the Nov 5 low of 26.2. It has trended down from about 65 in late September, so momentum is still weak, though the bounce from 26.2 to 29.2 hints at a possible oversold stabilization. [Bearish]
- 20 EMA (EMA 21 = $89.09): Price at $45.97 is about 48% below it, and the EMA is falling steeply (from $128 on Oct 19). It is also below EMA 55 ($112.51), a bearish crossover that has been in place since mid-October. The EMA acts as heavy overhead resistance. [Bearish]
- MACD: The line (-19.17) is below the signal (-14.36), and the gap has widened for most of the last 15 bars (-6.98 vs. -0.00 on Oct 19). The histogram is deeply negative and expanding, so there is no bullish crossover yet. [Bearish]
- Bollinger Bands (20): The bands are very wide (upper $135.97, lower $44.61). Price is hugging the lower band, and the Nov 5 candle pierced it. This is a stretched, oversold reading that often brings a relief bounce, but "walking the band" in a strong downtrend can persist. [Bearish]
- CMF (20): -0.304, well below -0.05 and at its lowest reading on the chart. It signals heavy, accelerating distribution, with no sign of accumulation. [Distribution]
- ADX (14): 33.7 and rising (21 to 33.7 over 15 bars). −DI (45.6) is far above +DI (12.9), so bears control a strong, established downtrend. [Strong Trend – Bearish]
- Volume: 298.85M, the largest spike on the chart, on a big red candle (Nov 5, -39%). This looks like capitulation or climactic selling. It confirms the force of the selloff, but it can also mark a short-term exhaustion low. [Bearish with possible capitulation]
DIVERGENCES & TRENDS
- There is no bullish RSI divergence yet. RSI made a lower low (26.2) alongside a lower price low ($40.87), so momentum confirms price.
- All trend tools are aligned down. EMA21 is below EMA55, and SMA50D ($115.20) has crossed below SMA200D ($124.13), a death cross that formed in late October. Price sits far below the SMA200D and VWAP ($112.35).
- MACD, CMF and ADX/−DI are all making new extremes in the bearish direction, which points to trend continuation rather than exhaustion.
- Price fell from about $107 (Oct 28) to $40.87 (Nov 5), a roughly 62% drop in 6 sessions. Moves this stretched often get sharp but short-lived counter-trend bounces. The Nov 6 close of $45.97 (+12.5%) is the first sign of one.
- A close back above the lower Bollinger Band with RSI rising from below 30 would be the first sign of stabilization. A bullish MACD crossover is likely weeks away.
CHART PATTERNS
- Clear downtrend with lower highs and lower lows: The structure since mid-October resembles a Descending Triangle / bearish continuation breakdown. Support near $82–83 failed on Oct 22, then the $66–68 area failed on Nov 5.
- Possible Bullish Falling Wedge (reference diagram): The sequence of lower highs and lower lows could be read as a falling wedge, but the volume spike and steep slope argue against it. It would need a break above the upper trendline, around $55–65, to confirm. Treat it as a secondary, low-probability read.
- No reliable reversal pattern is confirmed. Any bounce is more likely a bear-market rally than a bottom, with $55–67 (the prior breakdown zone) as the first supply area.
POTENTIAL SCENARIOS
- Scenario 1: Bearish Trend Continuation — The downtrend (ADX 33.7, −DI 45.6, CMF -0.30) resumes after a brief dead-cat bounce, and sellers push price back toward or below the Nov 5 low. Trigger: failure to hold $44–45 or a rejection at $50–55. Target: $39–42, with a possible spike toward $36. Invalidation: daily close above $55. (47% probability)
- Scenario 2: Bullish Oversold Relief Bounce — Capitulation volume and RSI near 26–29 spark a mean-reversion rally toward the breakdown zone. Trigger: close above $52 with RSI above 40 and a shrinking MACD histogram. Target: $55–66, the Nov 3–4 gap area. Invalidation: close below $40.87. (38% probability)
- Scenario 3: Neutral Volatile Basing — Price chops between roughly $40 and $55 as the market digests the capitulation. Trigger: low-volume consolidation above $40.87. Target: $44–50. Invalidation: close outside $40–55. (15% probability)
PRICE TARGETS
Range width check: $47.00 − $39.00 = $8.00, which is 17.4% of $45.97 and fits the guidance for a 27-day horizon. Extreme volatility (ATR $13.57) means the real risk of breaching this range is high, and a bounce is a meaningful risk to the bearish target.
- Target Price: $42.50 (27 days, Dec 5, 2026)
- Expected Range: $39.00 to $47.00
- Key Levels: Support at $40.87 (Nov 5 low), Resistance at $55.00 (first supply zone above, within the Nov 3–4 gap)
OVERALL BIAS
OVERALL BIAS: BEARISH - Every trend and momentum indicator is aligned down: price is below all moving averages, there is a death cross, MACD is below its signal and widening, ADX is 33.7 with −DI dominant, and CMF is at -0.30. The oversold RSI and climactic volume raise the odds of a sharp bounce, but with no confirmed reversal pattern, the trend-following evidence favors a lower price in 27 days.
This is educational analysis and not financial advice.