SOFI 27-day bullish forecast — Nov 8, 2026
- Bias: Bullish
- Timeframe: 27 days (made Nov 8, 2026, target date Dec 4, 2026)
- Price at analysis: $16.21
- Price target: $16.85
- Expected range: $14.95 – $17.75
- Result: Pending — graded after the close on Dec 4, 2026
Get a free AI analysis of SOFI today
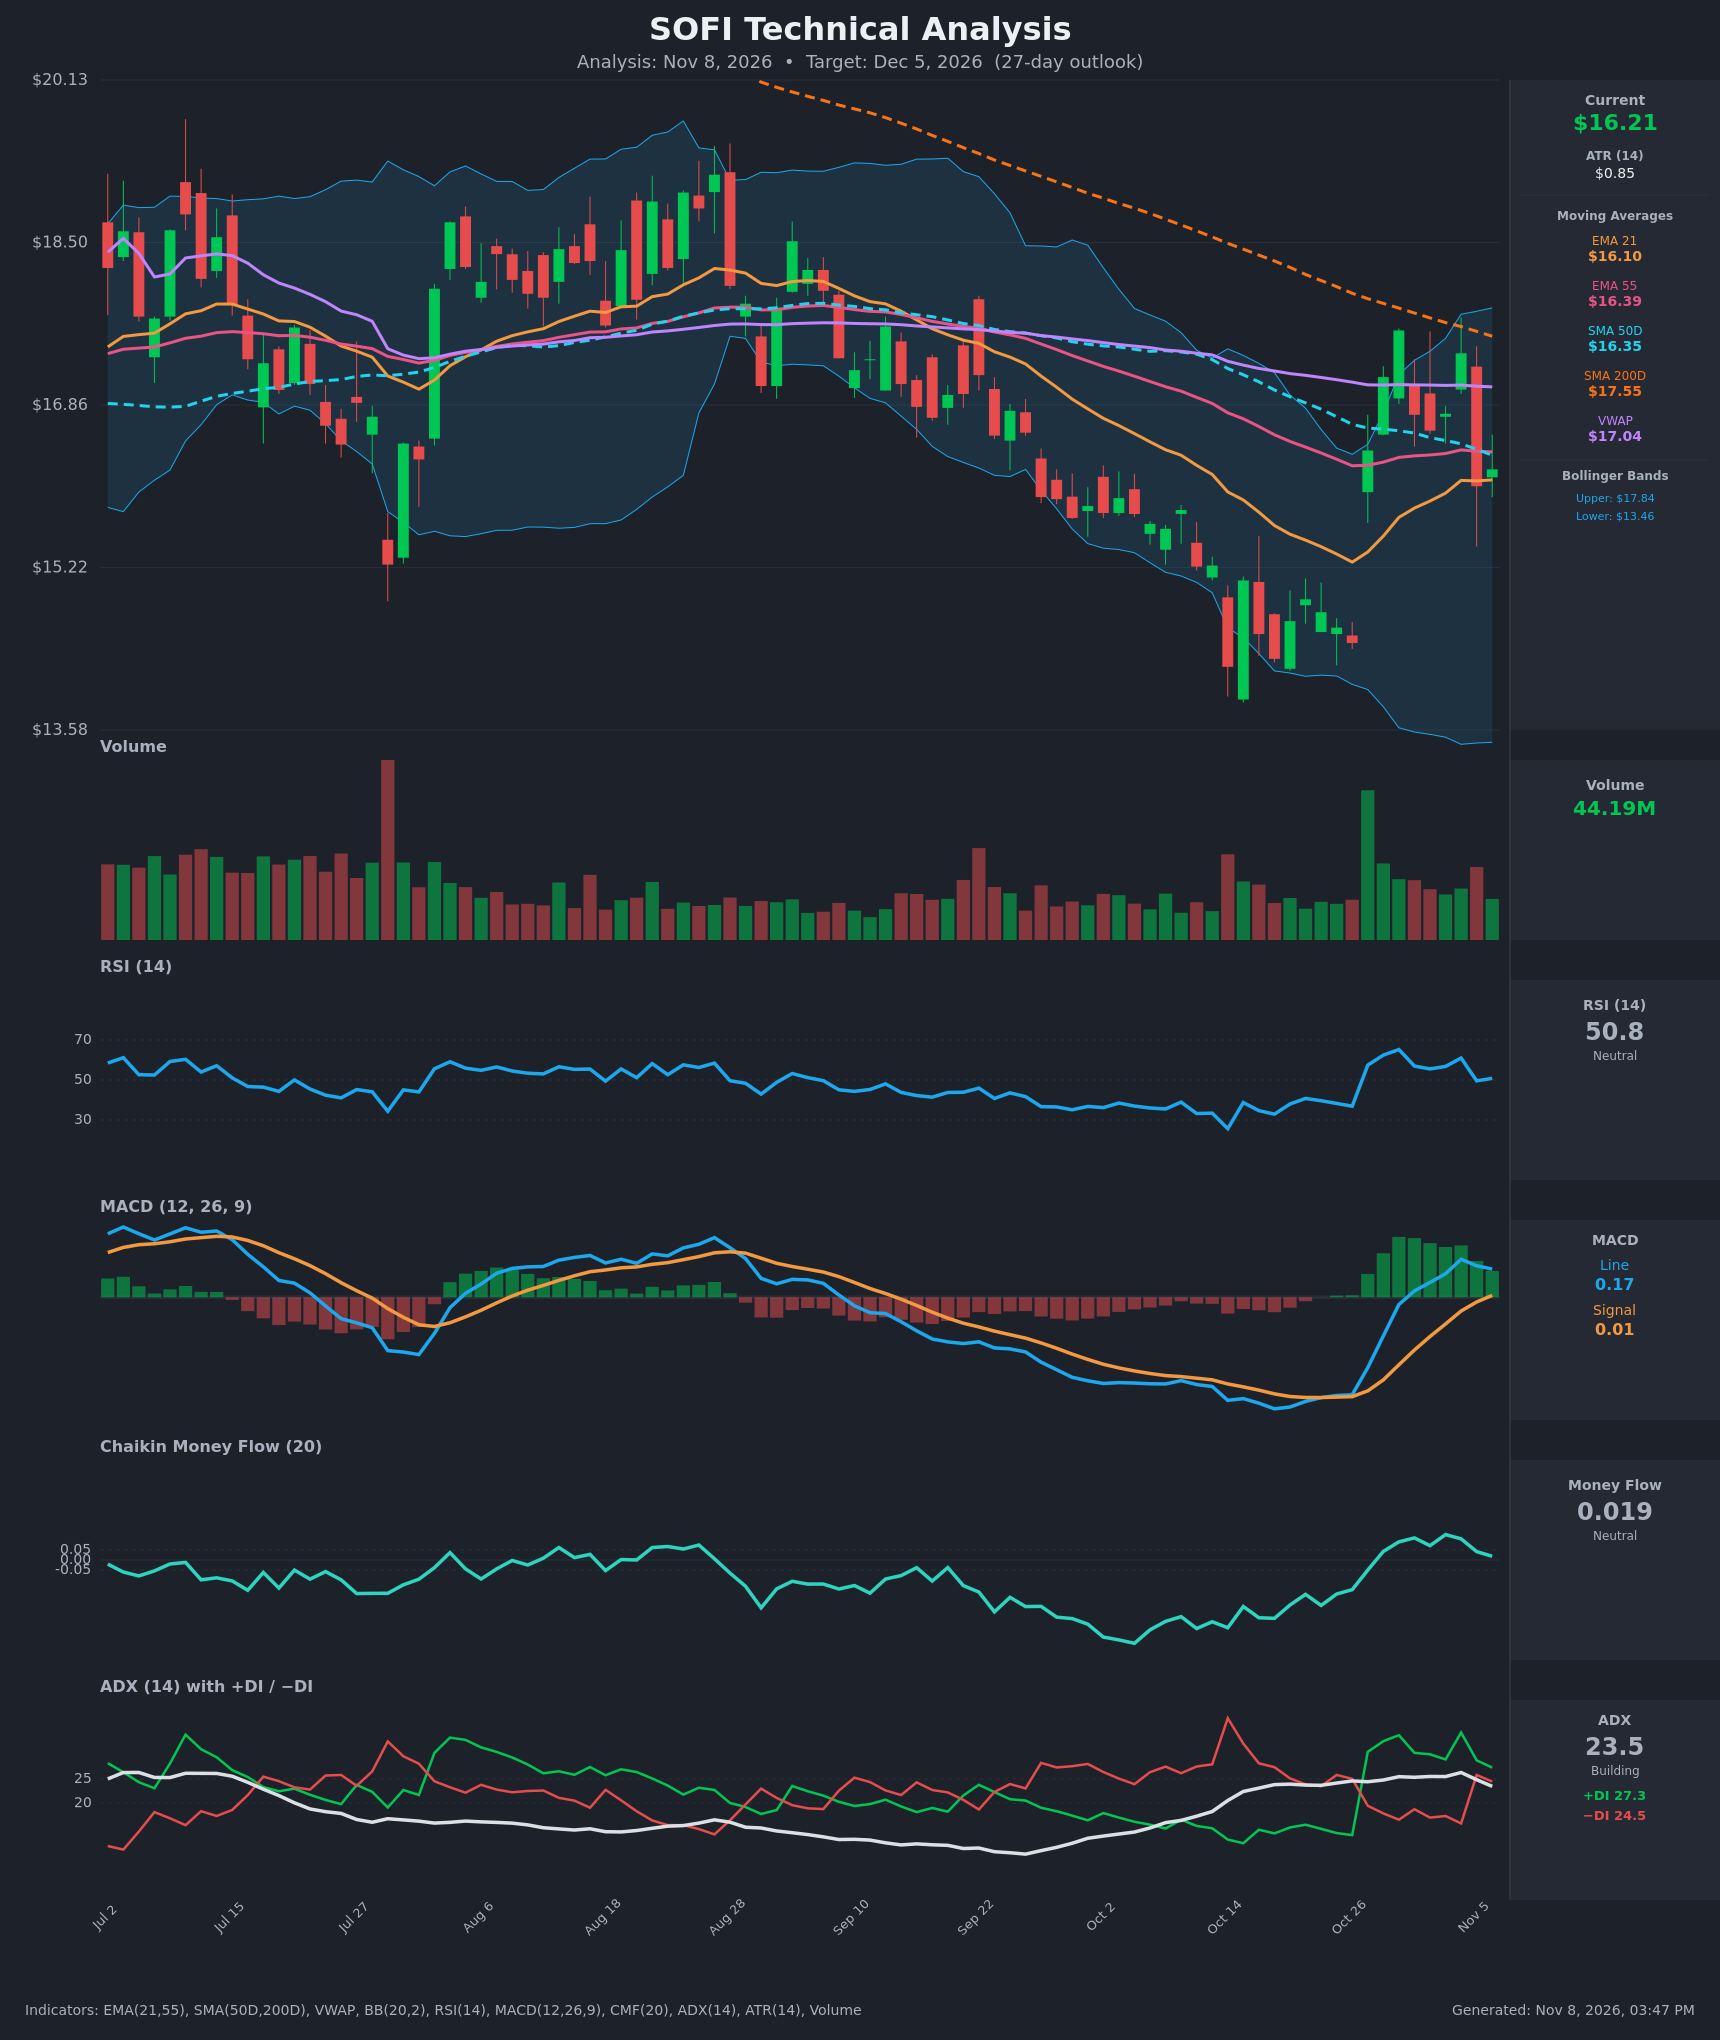
Analysis
TECHNICAL INDICATORS
- RSI (14): 50.83, dead neutral. It dropped from 65 (Oct 29) to about 50 after the Nov 5 reversal candle, so the bounce momentum has cooled but not broken. [Neutral]
- 20 EMA: EMA 21 is $16.10 and price ($16.21) is just above it, so it is marginal support. EMA 55 ($16.39) and SMA 50D ($16.35) sit just overhead, so price is wedged inside a tight cluster of averages. [Neutral]
- MACD: The line (0.172) crossed above the signal (0.011) on Oct 30 and has stayed above it, with a positive histogram of about +0.16. However, the line peaked at 0.232 on Nov 4 and is now rolling over, so the histogram is shrinking and the crossover is fading. [Bullish]
- Bollinger Bands (20): The bands run $13.46 to $17.84, and price is slightly above the midline (about $15.65). Bandwidth is wide after the Oct selloff and spike, so volatility is elevated. The upper band lines up with the descending trendline near $17.5-17.8, which caps upside. [Neutral]
- CMF (20): 0.019, inside the ±0.05 neutral zone. It has recovered from -0.29 on Oct 19 but is fading from 0.126 on Nov 3. Selling pressure has eased but there is no real accumulation yet. [Neutral]
- ADX (14): 23.5 and falling from 26.3, so trend strength is marginal. +DI (27.3) is above −DI (24.5), but the gap narrowed sharply on Nov 5, when −DI jumped from 15.8 to 25.8. Bulls have a slight edge in a weak trend. [Weak Trend, slight Bullish]
- Volume: 44.19M on the latest bar. The Oct 27 breakout bar had the heaviest volume of the period, which shows real buying interest at the $14.50 low. The high-volume red candle on Nov 5 shows sellers defending the $17.4 area. [Mixed: accumulation at the lows, supply near $17.4]
DIVERGENCES & TRENDS
- Price made a lower low (about $13.9 on Oct 14) while RSI held near 27-33 and MACD flattened. This was a mild bullish momentum divergence that led to the Oct 27 surge.
- The Oct 27 bounce lifted RSI from 37 to 65 and flipped MACD positive. The Nov 5 rejection pulled RSI back to 50 and the MACD line is rolling over, so momentum is fading in the short term.
- CMF has climbed from about -0.29 to slightly positive, a sustained improvement in money flow.
- Price has reclaimed EMA 21 but remains below EMA 55, SMA 50D, SMA 200D and VWAP. SMA 50D ($16.35) is below SMA 200D ($17.55), so the long-term structure is still a death-cross downtrend.
- The orange descending trendline from late August sits near $17.4-17.6 and capped the Oct 29 and Nov 4 highs. EMA 21 and SMA 50D are converging with price near $16.1-16.4, so a directional move is likely soon.
CHART PATTERNS
- Bullish Double Bottom / Inverted Head and Shoulders (emerging): Lows at about $13.9 and $14.3-14.5 (Oct 14 to 26) were followed by a sharp rally and a higher-low pullback toward $16. A neckline break above about $17.6 would project toward $19-20, but this is not confirmed.
- Descending trendline resistance (Bearish Rising Wedge-like rejection): The rally has failed twice near $17.4-17.6 under the falling trendline. If price loses the $15.5 higher low, the reversal thesis fails and a retest of $14.3 is possible.
- Interpretation: Price is in a basing, higher-low structure, but it is not yet a confirmed reversal. Targets lean modestly higher, toward the $17.0-17.5 resistance zone, within a wide range.
POTENTIAL SCENARIOS
- Scenario 1: Bullish Higher-Low Base and Grind Toward Resistance — The higher low holds above EMA 21 and the $15.50 wick low. Price recovers the EMA 55/SMA 50D cluster and tests VWAP and the falling trendline. Trigger: daily close above $16.40 (EMA 55/SMA 50D) with MACD holding above signal. Target: $17.00-$17.60. Invalidation: daily close below $15.50. (45% probability)
- Scenario 2: Bearish Rejection at Trendline and Failed Base — The Nov 5 rejection candle proves to be a lower high. The weak ADX and fading MACD lead to a loss of EMA 21 and the higher low, and sellers push price back toward the Oct lows. Trigger: close below $15.50 with MACD crossing back below signal. Target: $14.30-$14.80. Invalidation: close above $17.60. (35% probability)
- Scenario 3: Neutral Range Chop — Price oscillates between about $15.50 and $17.00 around the converged moving averages, with ADX staying below 25. Trigger: no close beyond either boundary. Target: $16.00-$16.60. Invalidation: close outside $15.30-$17.50. (20% probability)
PRICE TARGETS
Range width check: $17.75 - $14.95 = $2.80, or about 17.3% of $16.21. That fits the 12-18% guidance for 30-60 days and is the upper end of it, which suits a 27-day horizon with elevated ATR ($0.85).
- Target Price: $16.85 (27 days)
- Expected Range: $14.95 to $17.75
- Key Levels: Support at $15.50, Resistance at $17.04 (VWAP). Beyond that, the falling trendline and SMA 200D sit at $17.55-$17.60.
OVERALL BIAS
OVERALL BIAS: BULLISH - A higher-low base above the Oct lows, a MACD bull cross, +DI above −DI, recovering CMF and price holding above EMA 21 outweigh the fading momentum. The conviction is modest because price is still below SMA 200D, VWAP and the descending trendline, so the target stops short of the $17.5+ resistance.
This is educational analysis and not financial advice.