SMH 27-day bearish forecast — Nov 8, 2026
- Bias: Bearish
- Timeframe: 27 days (made Nov 8, 2026, target date Dec 4, 2026)
- Price at analysis: $463.96
- Price target: $450.00
- Expected range: $415.00 – $495.00
- Result: Pending — graded after the close on Dec 4, 2026
Get a free AI analysis of SMH today
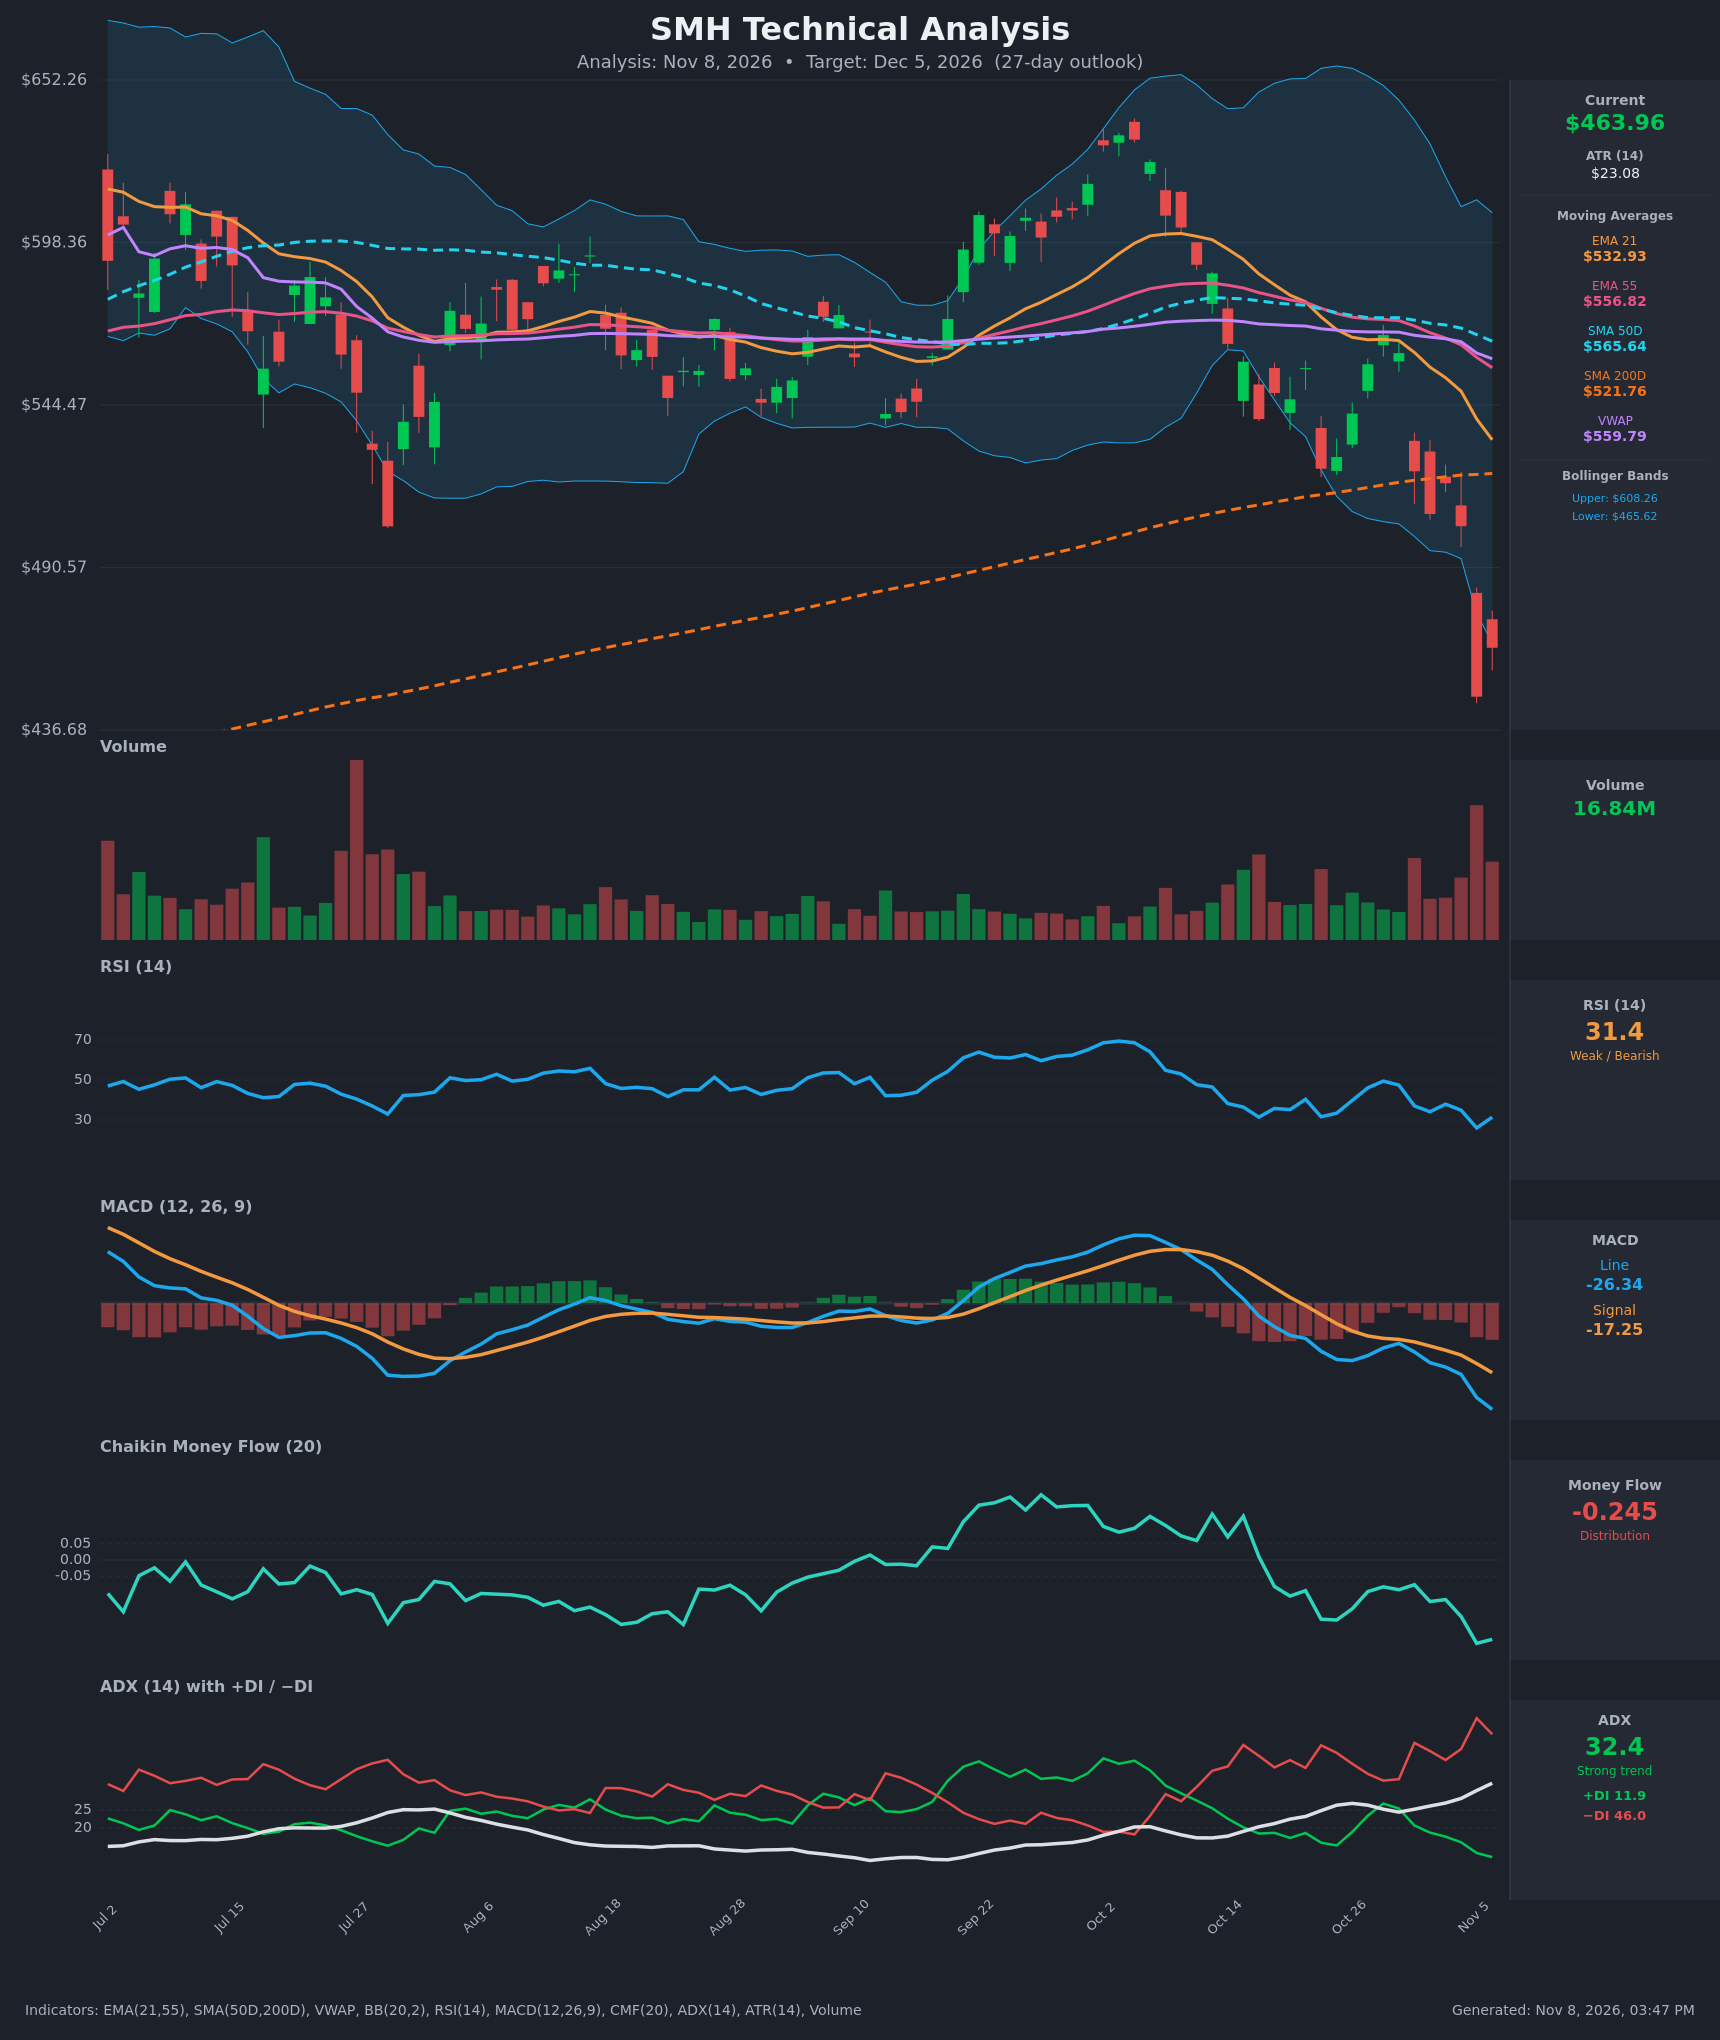
Analysis
TECHNICAL INDICATORS
- RSI (14): 31.4, bouncing off 26.0 on Nov 5, which was the lowest reading on the chart. It is still below 40 and in bearish territory. The Oct low was ~31, so the Nov 5 reading is a lower low in momentum that confirms the price drop. It is oversold but not yet turning up convincingly. [Bearish]
- 20 EMA: The supplied EMA 21 is $532.93, about 14.9% above price. It has been falling since Oct 28 and acts as dynamic resistance. EMA 21 crossed below EMA 55 ($556.82) around Oct 22, a bearish cross that is still intact. [Bearish]
- MACD: The line is -26.34 and the signal is -17.25. The line has been below the signal since Oct 21 and the gap is widening, with a histogram of about -9. This is accelerating bearish momentum with no sign of a turn. [Bearish]
- Bollinger Bands (20): Price at $463.96 sits just below the lower band ($465.62), after a close well outside it on Nov 5. The bands are expanding after a long squeeze, so this is a volatility expansion to the downside. In a strong trend, walking the lower band is common, but a stretch this far from the mean ($565 midline) raises the odds of a relief bounce. [Bearish]
- CMF (20): -0.245, well below -0.05 and at the lowest reading on the chart. CMF has been negative since mid-Oct, after peaking in the +0.2s in late Sep. This is heavy, sustained distribution. [Distribution]
- ADX (14): 32.4 and rising, with −DI at 46.0 far above +DI at 11.9. −DI crossed above +DI in mid-Oct and the spread keeps widening. This is a strong, established downtrend. [Strong Trend – Bearish]
- Volume: 16.84M, with Nov 5 the heaviest-volume bar of the whole chart, on a -11% down candle. Nov 6 stayed elevated on the bounce. That looks like a capitulation or liquidation event, and it shows aggressive selling. It can mark a short-term low, but it needs follow-through to confirm one. [Bearish – capitulation-type selling]
Other moving averages: price is below the SMA200 ($521.76), the SMA50 ($565.64), VWAP ($559.79) and EMA 55. The SMA50 is rolling over toward the SMA200, a $44 gap that is narrowing. A death cross is possible later in or after the window if price stays depressed.
DIVERGENCES & TRENDS
- There is no bullish RSI or MACD divergence. RSI made a lower low (26 vs ~31) along with price, so momentum confirms the decline.
- MACD is accelerating lower with a widening negative histogram, and −DI is rising. The trend indicators agree with each other.
- Price broke below the SMA200 on a gap-style drop and has not reclaimed it. The Oct 28 rally to ~$568 was a lower high, followed by a sharp breakdown.
- The only counter-signals are stretch-related. Price is at or below the lower Bollinger Band and RSI is near oversold. After the Nov 5 capitulation volume, a bounce toward $500–$530 is plausible. That bounce would be a counter-trend rally inside a downtrend, not a trend change.
CHART PATTERNS
- Bearish Head and Shoulders (distribution top, loose): The late-Sep to early-Oct run to ~$640 formed the head. Lower highs near ~$570–$590 in mid and late Oct formed the right shoulder. The neckline sat around ~$545–$505 (the Oct lows and the Nov 4 close). The Nov 5 break below the neckline on heavy volume is the trigger. The measured move is head ($640) minus neckline ($545), about $95, projected from the break, which gives ~$450.
- Bearish continuation context: The structure of lower highs and lower lows since early Oct, with price below the declining EMA 21, resembles a bearish trend continuation. The breakdown from the Oct 14–Oct 28 consolidation (a bearish flag/pennant-type pause) supports follow-through.
- The reference pattern with the most weight is the bearish head and shoulders. Its target of ~$450 is only modestly below current price, so a bounce followed by a retest is likely along the way.
POTENTIAL SCENARIOS
- Scenario 1: Bearish Trend Continuation / Measured Move — The downtrend persists after a brief relief bounce. Sellers defend the broken neckline and the SMA200 area, and price grinds toward the H&S measured move. Trigger: a failed bounce below ~$505 and a close below $447.73. Target: $440–$450, with an extension to ~$420 if support fails. Invalidation: a daily close above $521.76 (the SMA200). (50% probability)
- Scenario 2: Bullish Oversold Relief Rally — The capitulation volume marks a short-term low and price mean-reverts toward the falling EMA 21. Trigger: RSI turns up through 40 and price closes back above the lower Bollinger Band and $504. Target: $505–$530 (the Nov 4 close and the SMA200 / EMA 21 zone). Invalidation: a close below $447.73. (35% probability)
- Scenario 3: Neutral Basing Range — Price chops between ~$445 and ~$500 as volatility settles after the shock. Trigger: low volume and RSI holding 30–45 with no close beyond either edge. Target: ~$465–$480. Invalidation: a close beyond either edge of the range. (15% probability)
PRICE TARGETS
- Target Price: $450.00 (27-day horizon; the H&S measured move, below the current $463.96)
- Expected Range: $415.00 to $495.00 (width $80, about 17.2% of current price, within the 12–18% guidance for 30–60 days, scaled for 27 days)
- Key Levels: Support at $447.73, Resistance at $504.27
OVERALL BIAS
OVERALL BIAS: BEARISH - ADX of 32 with −DI at 46 vs +DI at 11.9, a widening negative MACD, CMF of -0.245, price below every key moving average (including the SMA200), and a confirmed neckline break on record volume all point lower. Oversold conditions make a relief bounce likely along the way, so conviction is moderate.
This is educational analysis and not financial advice.