SPY 27-day bearish forecast — Nov 8, 2026
- Bias: Bearish
- Timeframe: 27 days (made Nov 8, 2026, target date Dec 4, 2026)
- Price at analysis: $735.29
- Price target: $722.00
- Expected range: $688.00 – $778.00
- Result: Pending — graded after the close on Dec 4, 2026
Get a free AI analysis of SPY today
Analysis
TECHNICAL INDICATORS
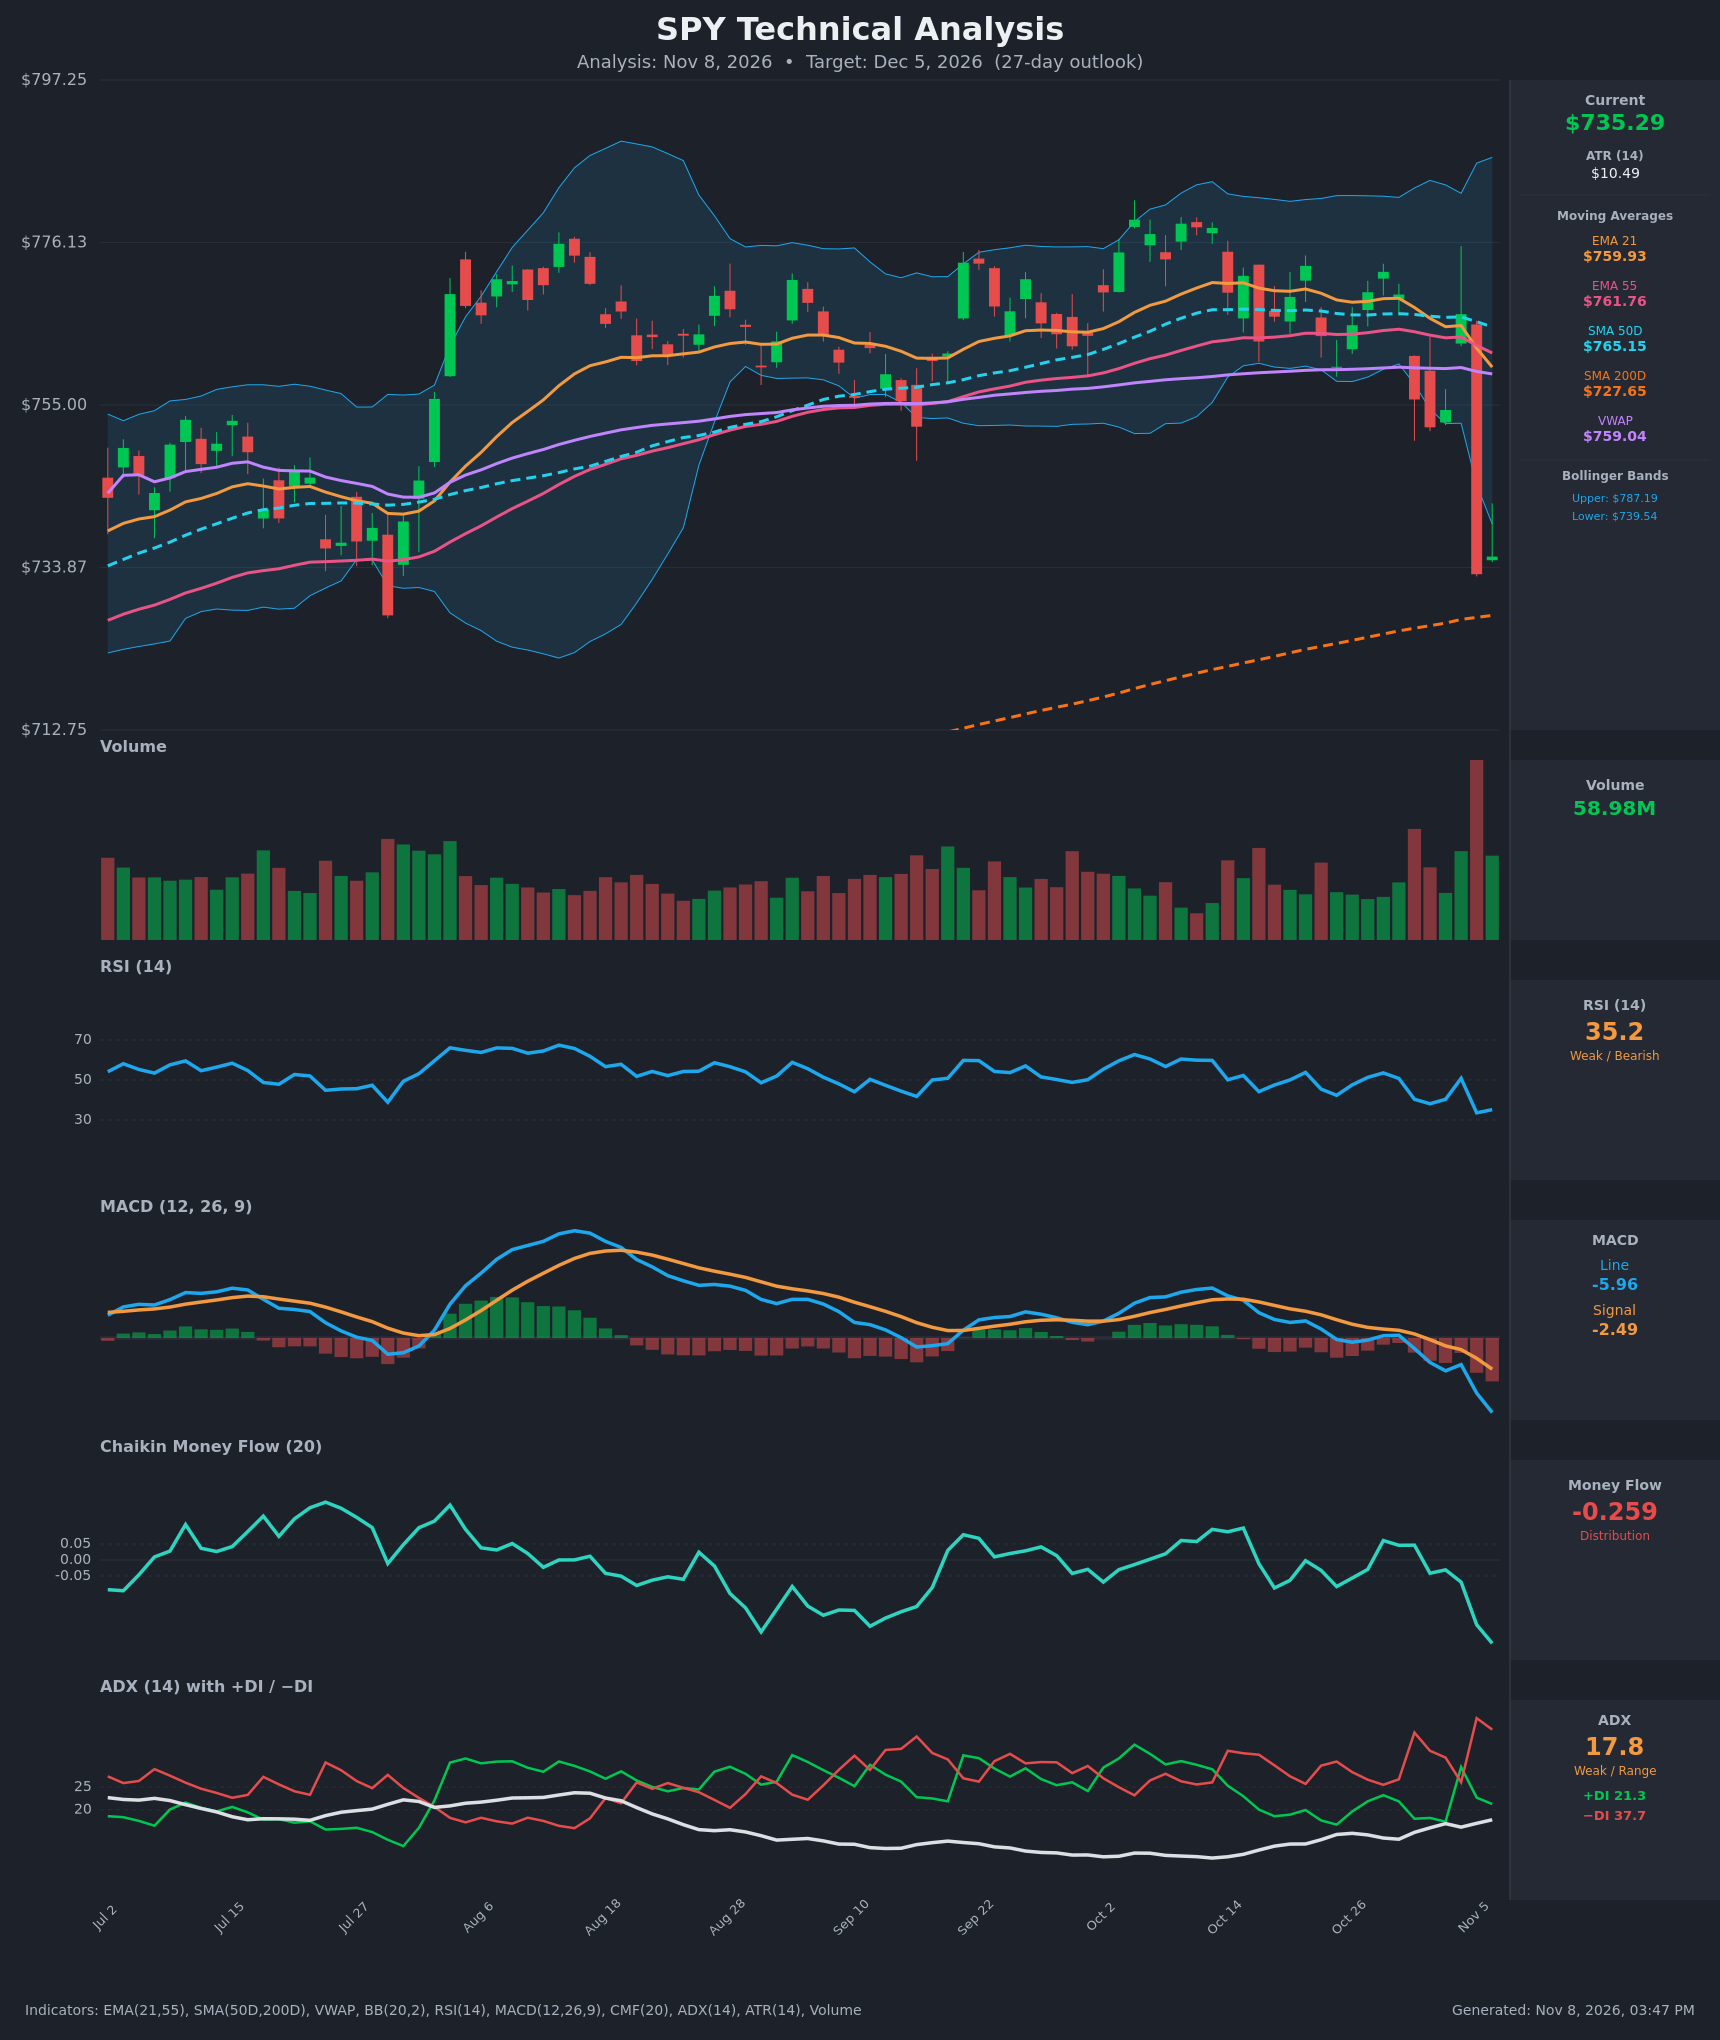
- RSI (14): 35.18, down from 50.8 on Nov 4 and close to the 30 oversold line. Momentum is clearly falling and has not yet shown a bullish turn. [Bearish]
- 20 EMA (EMA 21 = $759.93): Price at $735.29 is about 3.2% below it. EMA21 has also crossed below EMA55 ($761.76) on Nov 5, and the EMA21 slope is now down. The EMAs act as overhead resistance. [Bearish]
- MACD: Line -5.96 is below signal -2.49, and both are below zero. The bearish crossover happened on Oct 30, and the gap and negative histogram have widened over the last three sessions. [Bearish]
- Bollinger Bands (20): Upper $787.19, lower $739.54. Price is below the lower band after a sharp expansion, so it is stretched. A close below the lower band in a downtrend can mean a continuing "walk" down, but it also raises the odds of a snap-back toward the midline (about $763). [Bearish]
- CMF (20): -0.259, well below -0.05 and falling steeply from slightly positive readings in late October. This is heavy distribution. [Distribution]
- ADX (14): 17.8, below 20, so the trend is weak. −DI (37.7) is far above +DI (21.3), which means sellers dominate. ADX is turning up, which hints at a new trend developing to the downside. [Weak Trend, bearish direction]
- Volume: Nov 5 was the largest volume bar on the chart, on a roughly -4.4% down candle ($766.81 to $733.00). The latest bar, at 58.98M, is a small bounce on heavy volume. This looks like a distribution or capitulation event. Follow-through next to the SMA200 will decide which. [Bearish, with possible capitulation]
- Other moving averages and VWAP: Price is below VWAP ($759.04), SMA50D ($765.15) and EMA55. It is still above SMA200D ($727.65), which is the last major support and sits only about 1% below. SMA50D is well above SMA200D, so there is no death cross yet. [Bearish near term, long-term intact]
DIVERGENCES & TRENDS
- There is no bullish RSI or MACD divergence. RSI and MACD are making new lows together with price, so momentum confirms the decline.
- CMF turned from neutral/positive to -0.259 within about a week, a sharp deterioration in money flow. The Nov 5 gap-down came on a volume spike.
- Recent crossovers are all bearish: EMA21 under EMA55, MACD under signal, price under the 21/55/50D averages and VWAP, and −DI above +DI.
- ADX is below 20 but rising, which fits a transition from a range into a downtrend rather than an established trend.
- Price is hugging the lower Bollinger band, and RSI is near 30. A relief bounce is possible, but it would probably be capped near the EMA21/VWAP area ($752–$760).
CHART PATTERNS
- Bearish Double/Triple Top into a range breakdown: Highs near $772–$780 (Aug, Oct 21, Oct 28) have repeatedly failed. Price then broke the neckline/range support around $752–$755 on Nov 5. The measured move is about $23 (from about $775 to $752), which projects to roughly $729. That is almost exactly the SMA200D at $727.65, so this is a confluence zone.
- Rectangle range (about $733–$775): The July–November range is being tested at its floor. A decisive close below about $733 would be a Bearish Triple Top-style breakdown, with a possible extension toward the $705–$715 area.
- The pattern is not fully confirmed. The first close beneath the SMA200D would be the confirmation.
POTENTIAL SCENARIOS
- Scenario 1: Bearish SMA200 Test and Grind Lower — Sellers keep control (−DI dominant, CMF negative). Price retests the $727–$733 floor and drifts to or just below the SMA200 as the measured move completes. Trigger: failure to reclaim $746–$752 on any bounce, and a daily close below $733. Target: $715–$725. Invalidation: daily close above $760 (EMA21/VWAP). (45% probability)
- Scenario 2: Bullish Relief Rally — Capitulation volume and an RSI near 30 prompt a mean-reversion bounce from the SMA200 and the lower band back toward the declining EMAs. Trigger: close above $752 with RSI back above 45 and CMF improving. Target: $755–$762. Invalidation: close below $727. (35% probability)
- Scenario 3: Bearish Breakdown Acceleration — The SMA200 gives way and ADX rises above 25 with −DI leading. Price extends the Triple Top breakdown. Trigger: close below $727 on rising volume. Target: $695–$710. Invalidation: reclaim of $740 within two sessions. (20% probability)
PRICE TARGETS
- Target Price: $722.00 (27-day horizon)
- Expected Range: $688.00 to $778.00 (width $90, about 12.2% of the current price, consistent with the 30–60 day guidance of 12–18% for this horizon)
- Key Levels: Support at $727.65 (SMA200D), with deeper support near $705. Resistance at $752.10, then $759.93 (EMA21).
OVERALL BIAS
OVERALL BIAS: BEARISH - Price has broken below the EMA21, EMA55, SMA50D and VWAP. MACD is crossing down and widening, CMF is at -0.259, −DI dominates, and the range support was lost on the heaviest volume of the chart. The SMA200 near $727 is the key support, and a relief bounce toward $752–$760 is a real risk but is more likely to fade than to reverse the trend.
This is educational analysis and not financial advice.